MENU
MENU
At its core, spectroscopy is a very simple concept: light reveals what is happening in a source or sample. Sometimes you see narrow lines (typical of atoms), sometimes broad »peaks« (typical of molecules, phosphors, or fluorescence), and sometimes even dips when light is »swallowed« along the way (absorption).
This overview page therefore organizes our application examples not by source, but by physical mechanism. This helps students immediately ask the right question when looking at the spectrum: »What is creating this structure—and why?«
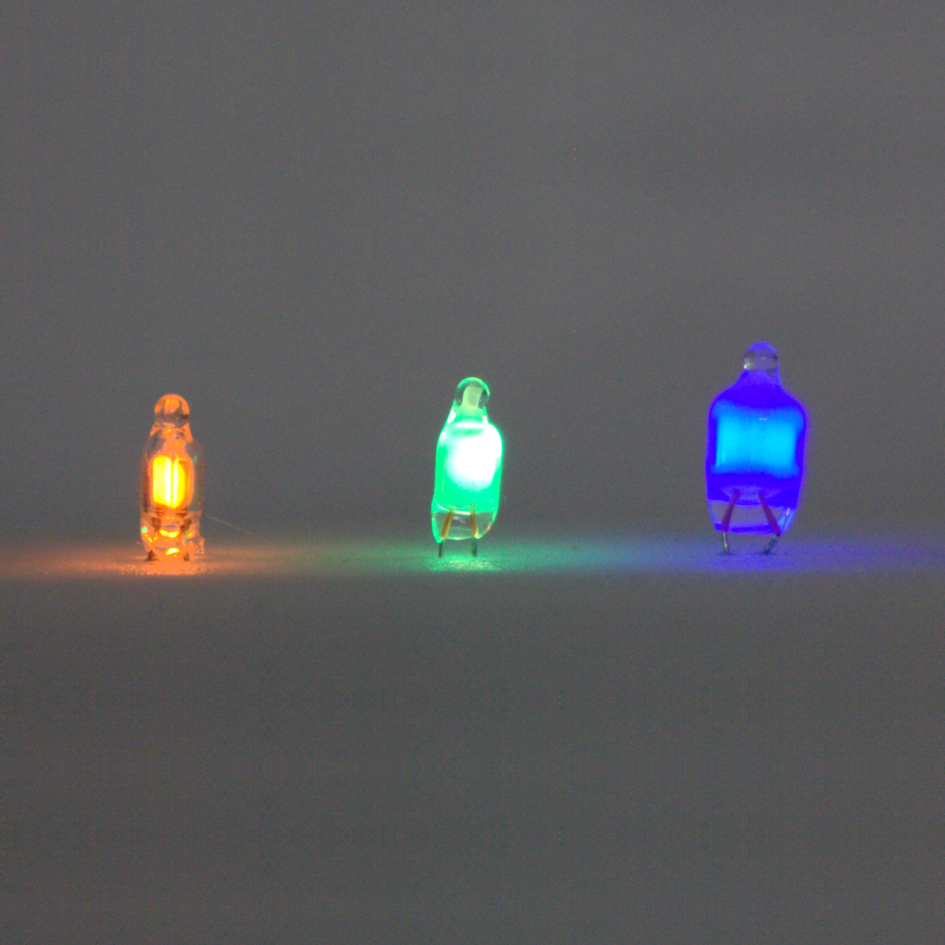
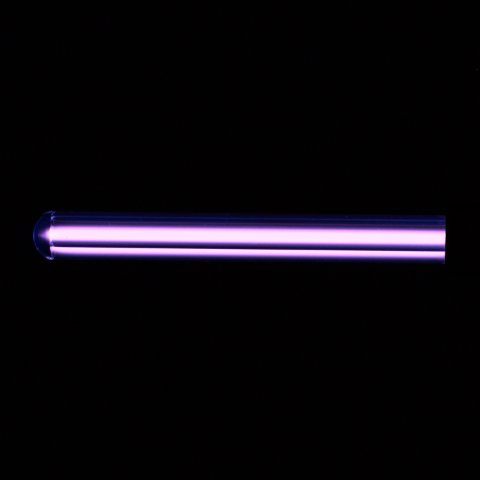
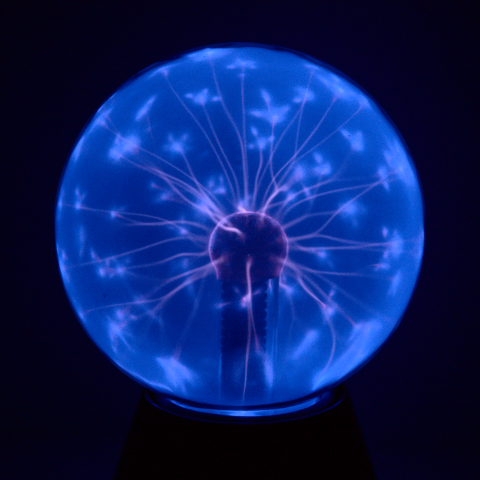
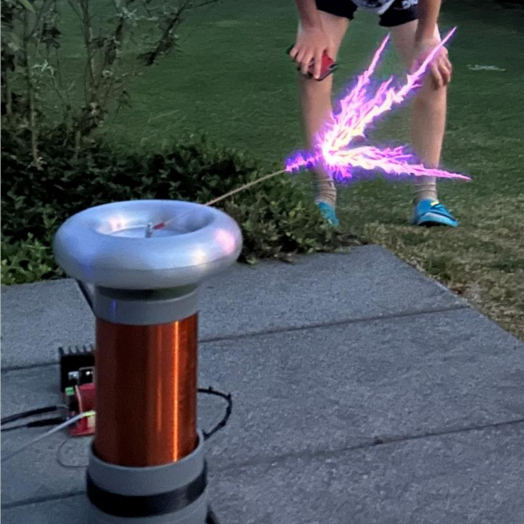
Basic idea: Electric fields excite atoms/ions ➙ as they return to their ground state, sharp lines appear at very specific wavelengths.
In gas discharges, the energy levels of the atoms are discrete—which is why the spectra resemble barcode patterns. Depending on the gas filling, pressure, and »operating state« (cold/warm), intensities change and additional lines sometimes appear. Ideal for playfully practicing calibration, line identification, and »Which atoms are present?«
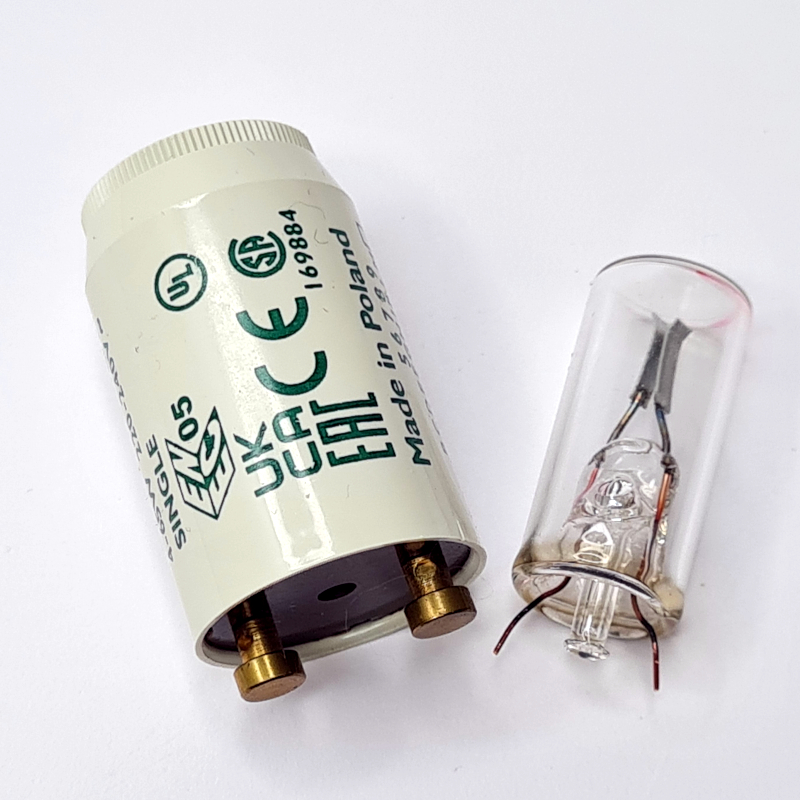
Basic idea: A discharge produces (among other things) UV light ➙ a phosphor converts this into visible light ➙ in the spectrum: lines + band emission.
This is the perfect bridge between »atomic lines« and »broad peaks«. It clearly demonstrates that color does not necessarily have to come »directly« from the gas discharge, but is often produced via a conversion layer. Along the way, you learn about warm-up effects (initial gas lines vs. components that dominate later).
Basic idea: Light can be selectively absorbed along its path—and that is exactly where dark lines or »dips« appear.
Here, you learn what is perhaps the most important shift in perspective: structures in the spectrum are not always emissions. Absorption can punch lines out of a continuum (Sun) or even dent a strong emission line »from the inside out« (self-reversal). Great for teaching, because it leads directly to the question: »Where is the absorber located—and what does the light path look like?«
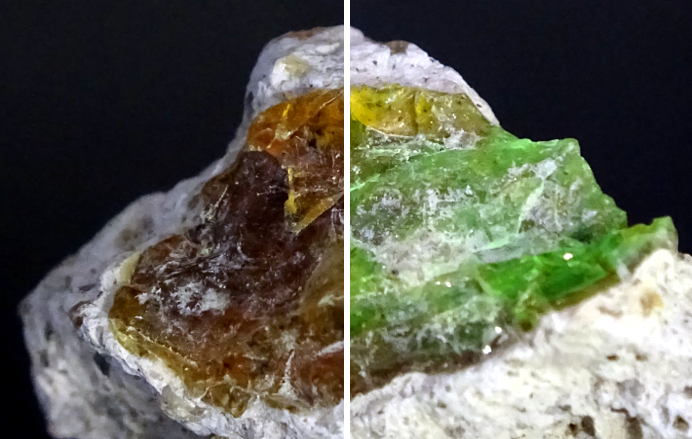
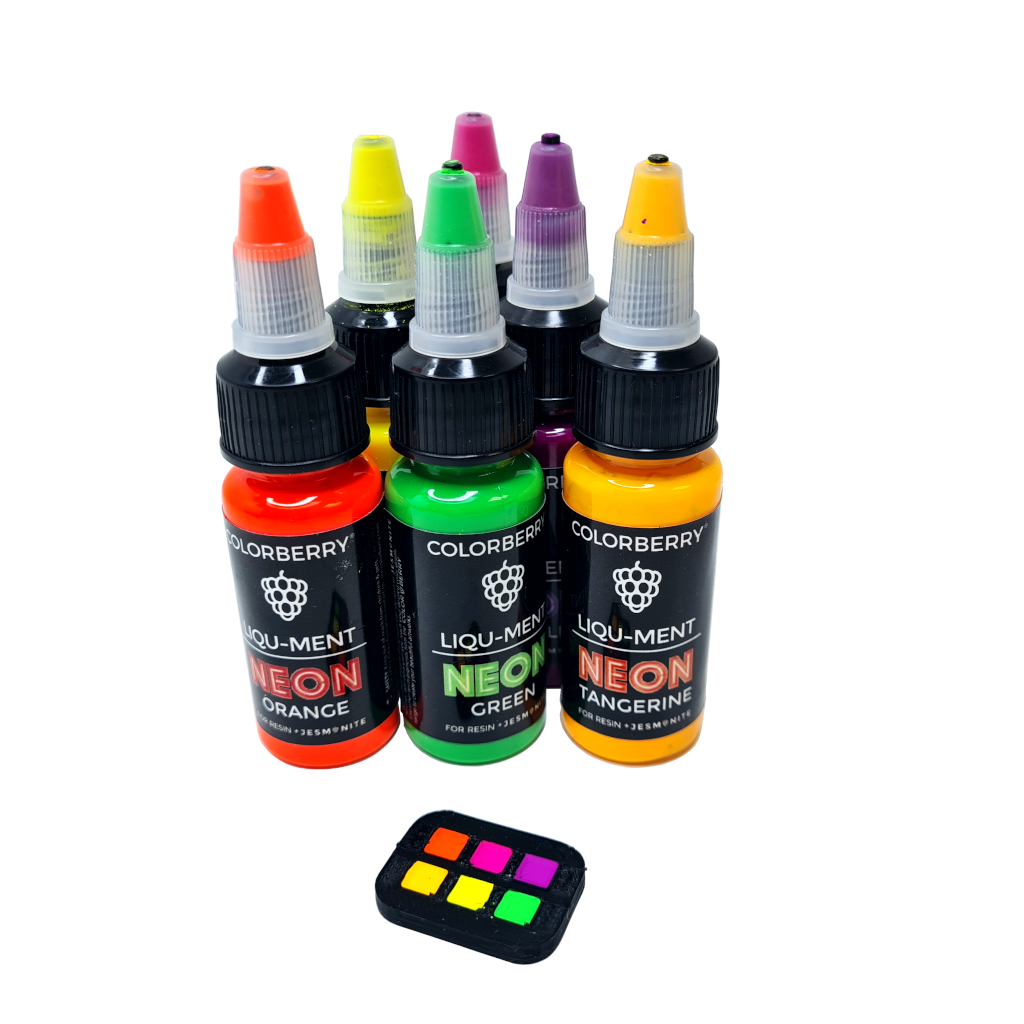
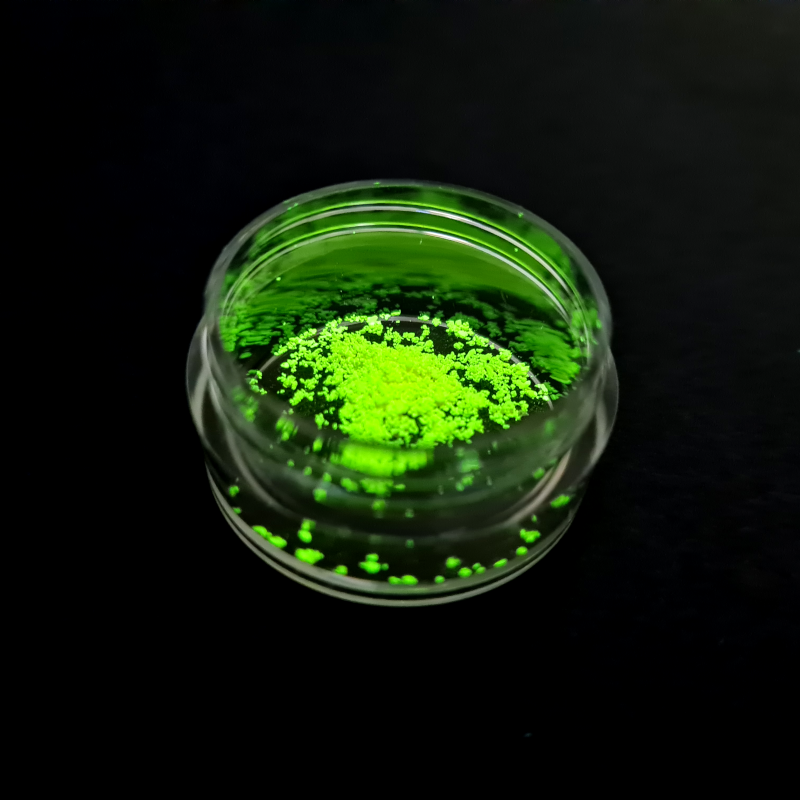
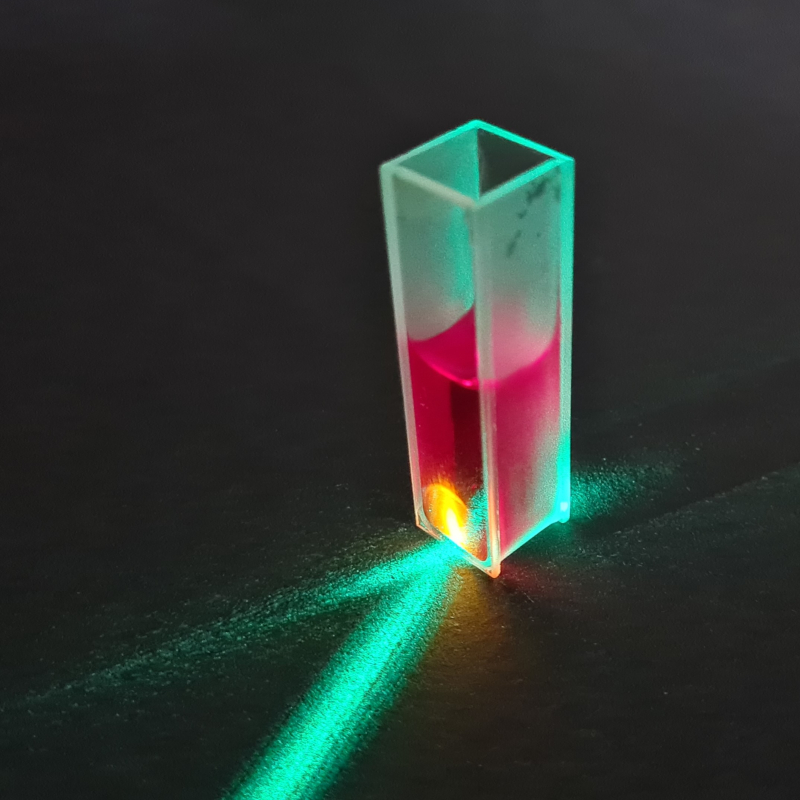
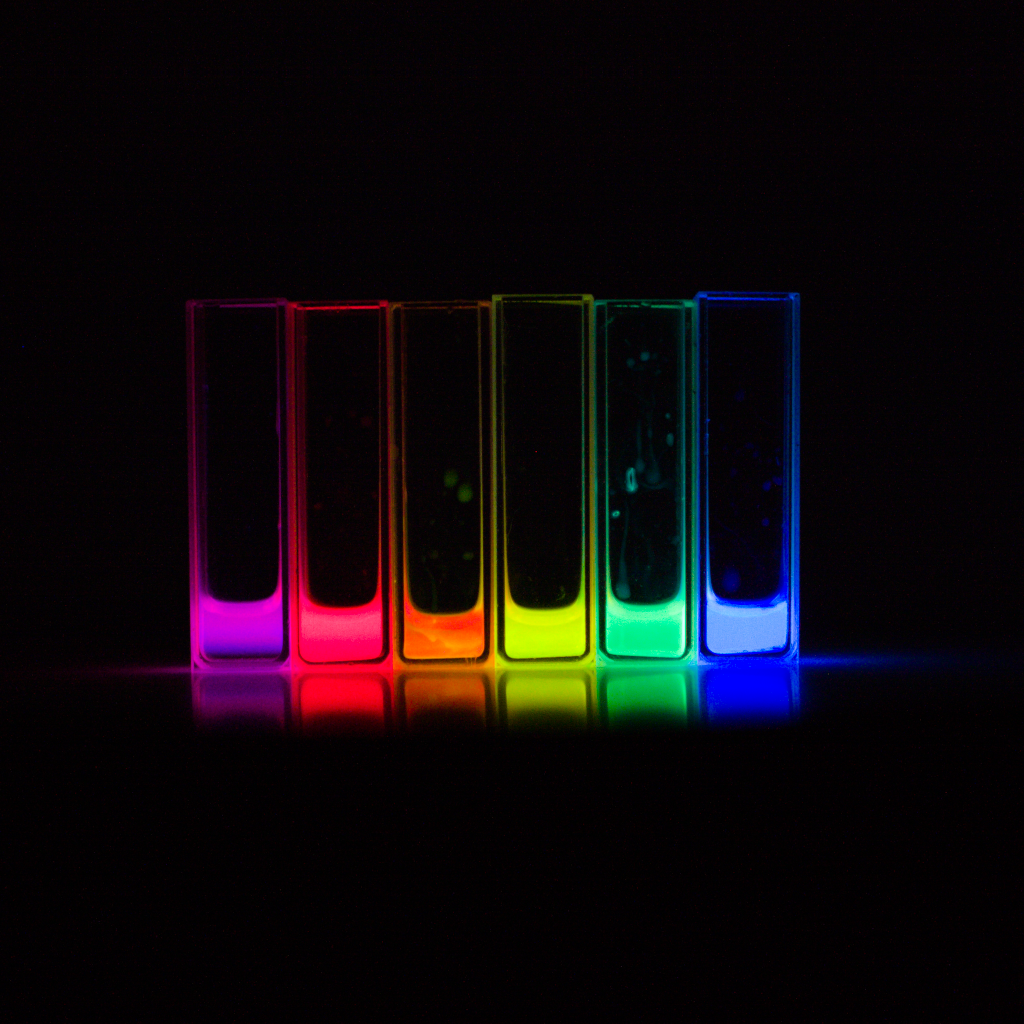
Basic idea: A material absorbs excitation light (often UV/blue) and then emits light at a longer wavelength ➙ usually broad emission bands.
Fluorescence is the gateway to molecular and solid-state physics: vibronic transitions, activator ions, defect centers—everything suddenly becomes visible. And: These experiments are extremely »show-worthy«, because the glow is impressive even to the naked eye, while the spectrum explains the underlying structure.
Basic concept: In chemiluminescence, light is produced directly during a chemical reaction. The reaction creates excited molecules (or excites a dye), which emit light as they return to their ground state—usually as a broad band rather than narrow lines.
This is the »cold-light« branch of spectroscopy: no hot flame, no gas discharge, no phosphor—just chemistry that produces photons. That is precisely why these spectra are so useful for teaching: one can quickly recognize the difference between band-shaped molecular emission and line-shaped atomic emission. Ideal as an introduction before things get »hot« in the next section.
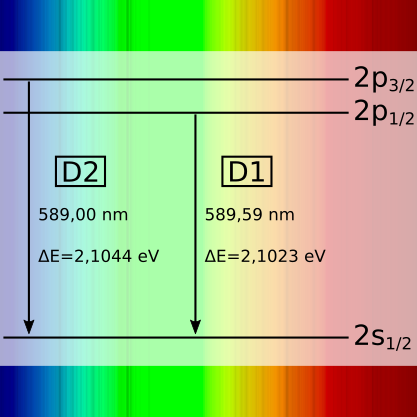
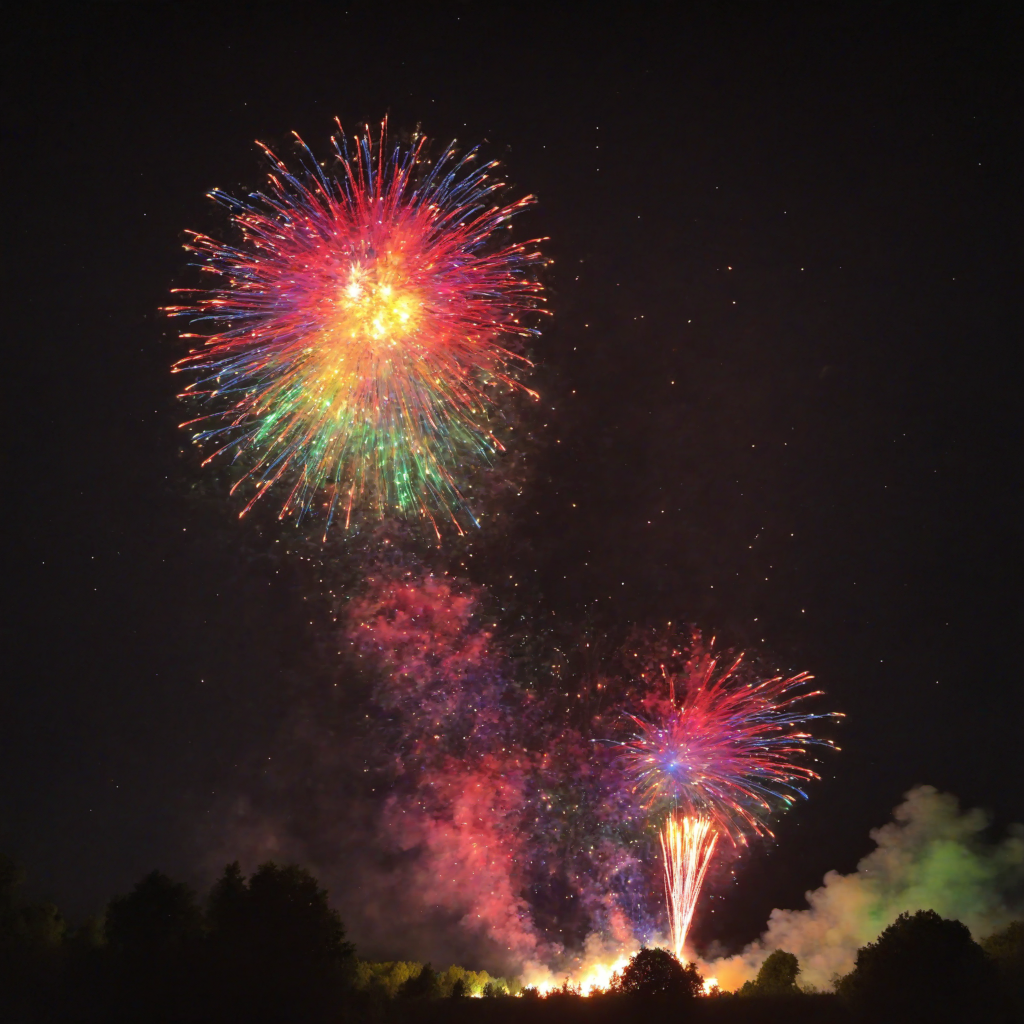
Basic idea: In pyrotechnics, chemistry provides the energy—but the light is generated in the hot flame/plasma zone. There, atoms and molecules are excited, leading to emission lines (e. g., Na, K, Cu…) and molecular bands (e. g., certain halide/oxide systems). In addition, a continuum may occur when incandescent particles contribute to the radiation.
This is the »hot-glowing« counterpart to chemiluminescence: The reaction is the engine, but the spectrum is the record of what is actually happening in the flame. This is exactly where spectroscopy becomes a game of detective work: Why does yellow dominate so often (Na-D)? Why is pure blue so elusive? And how do lines, bands, and continua differ in a single measurement image?
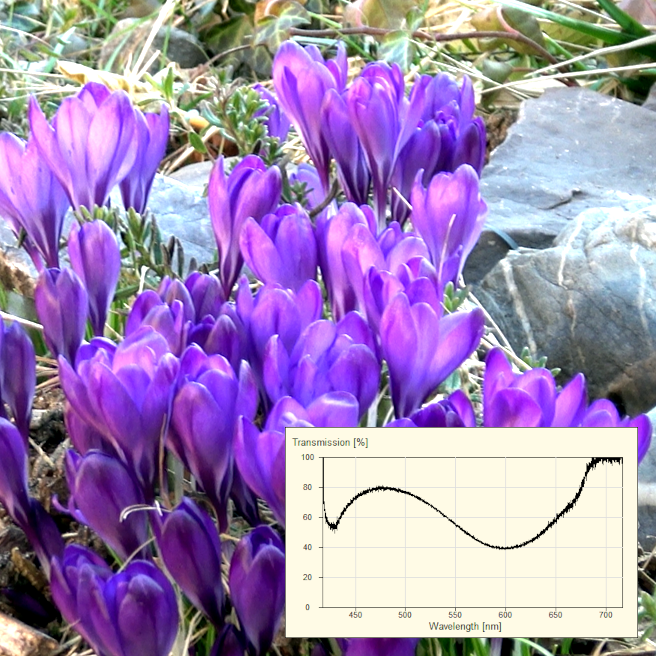
Basic idea: White light passes through a sample ➙ certain wavelengths are absorbed ➙ the transmission spectrum shows which colors come through.
This is the cleanest introduction to analytical spectroscopy: You're not measuring »luminescence,« but rather »filtering effects.« It gets especially cool when the molecular shape changes (pH-dependent) and the spectrum visibly shifts—exactly what students will later encounter as »structure ↔ spectrum.«
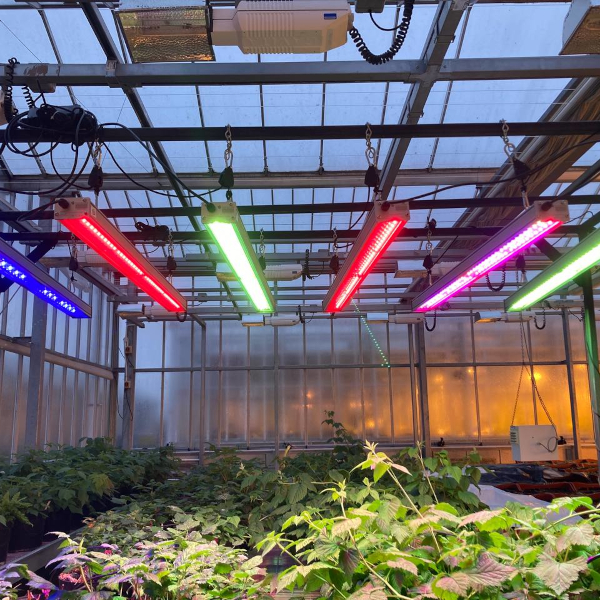
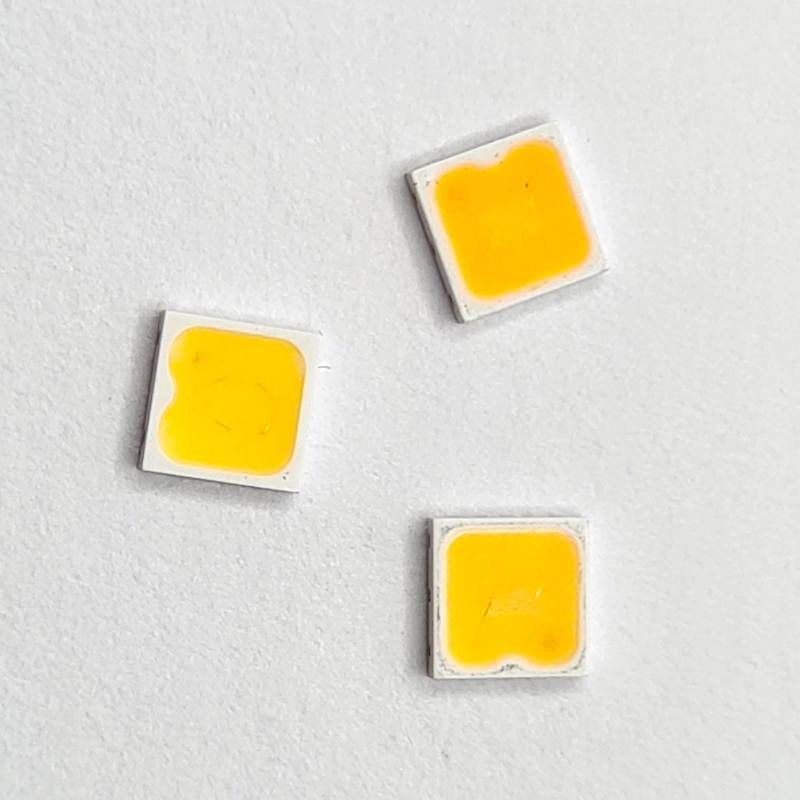
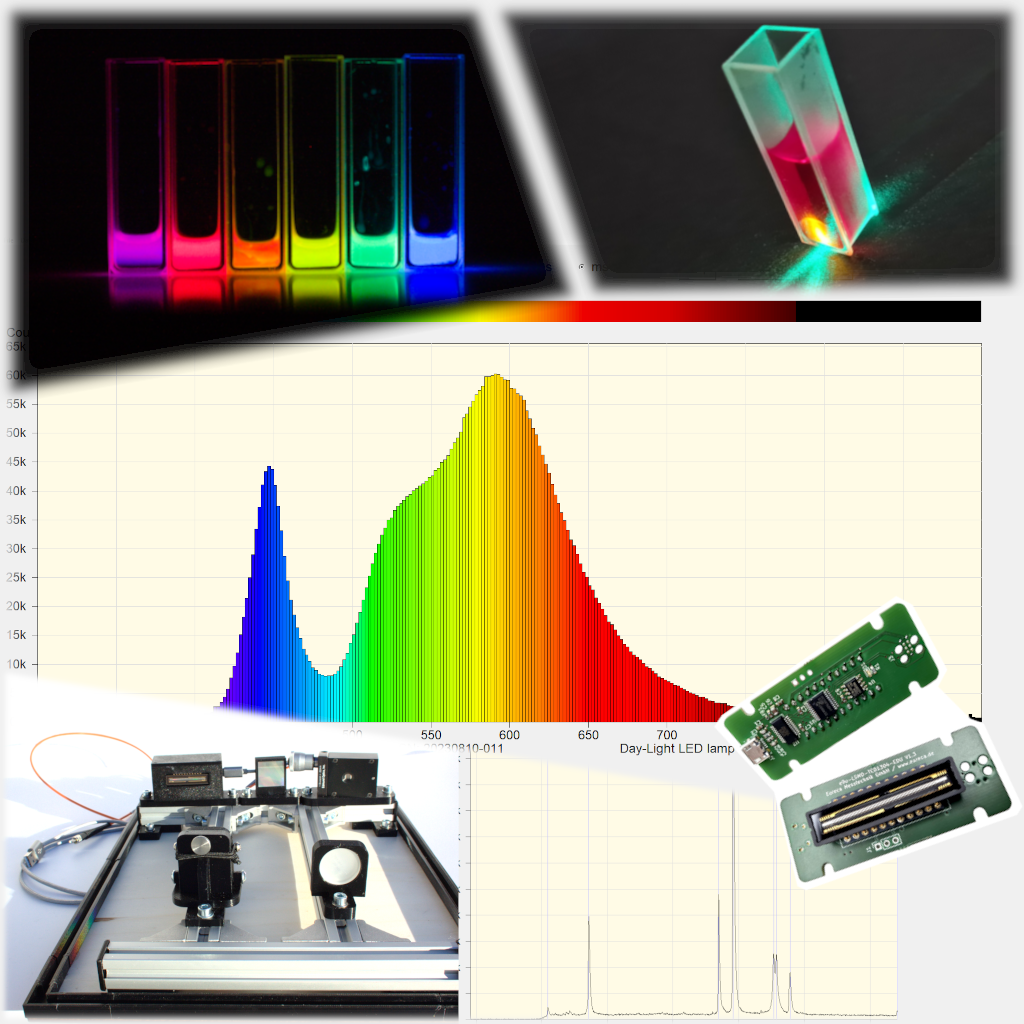
Basic idea: In LEDs, recombination within the semiconductor generates light; in white LEDs, this is often combined with phosphor conversion.
LEDs are ideal for understanding »spectrum as a design parameter«: narrow semiconductor peaks vs. broad phosphor bands, and in multi-channel systems, you can directly see how spectral channels are mixed. This turns »Kelvin on the package« into a physically tangible curve.
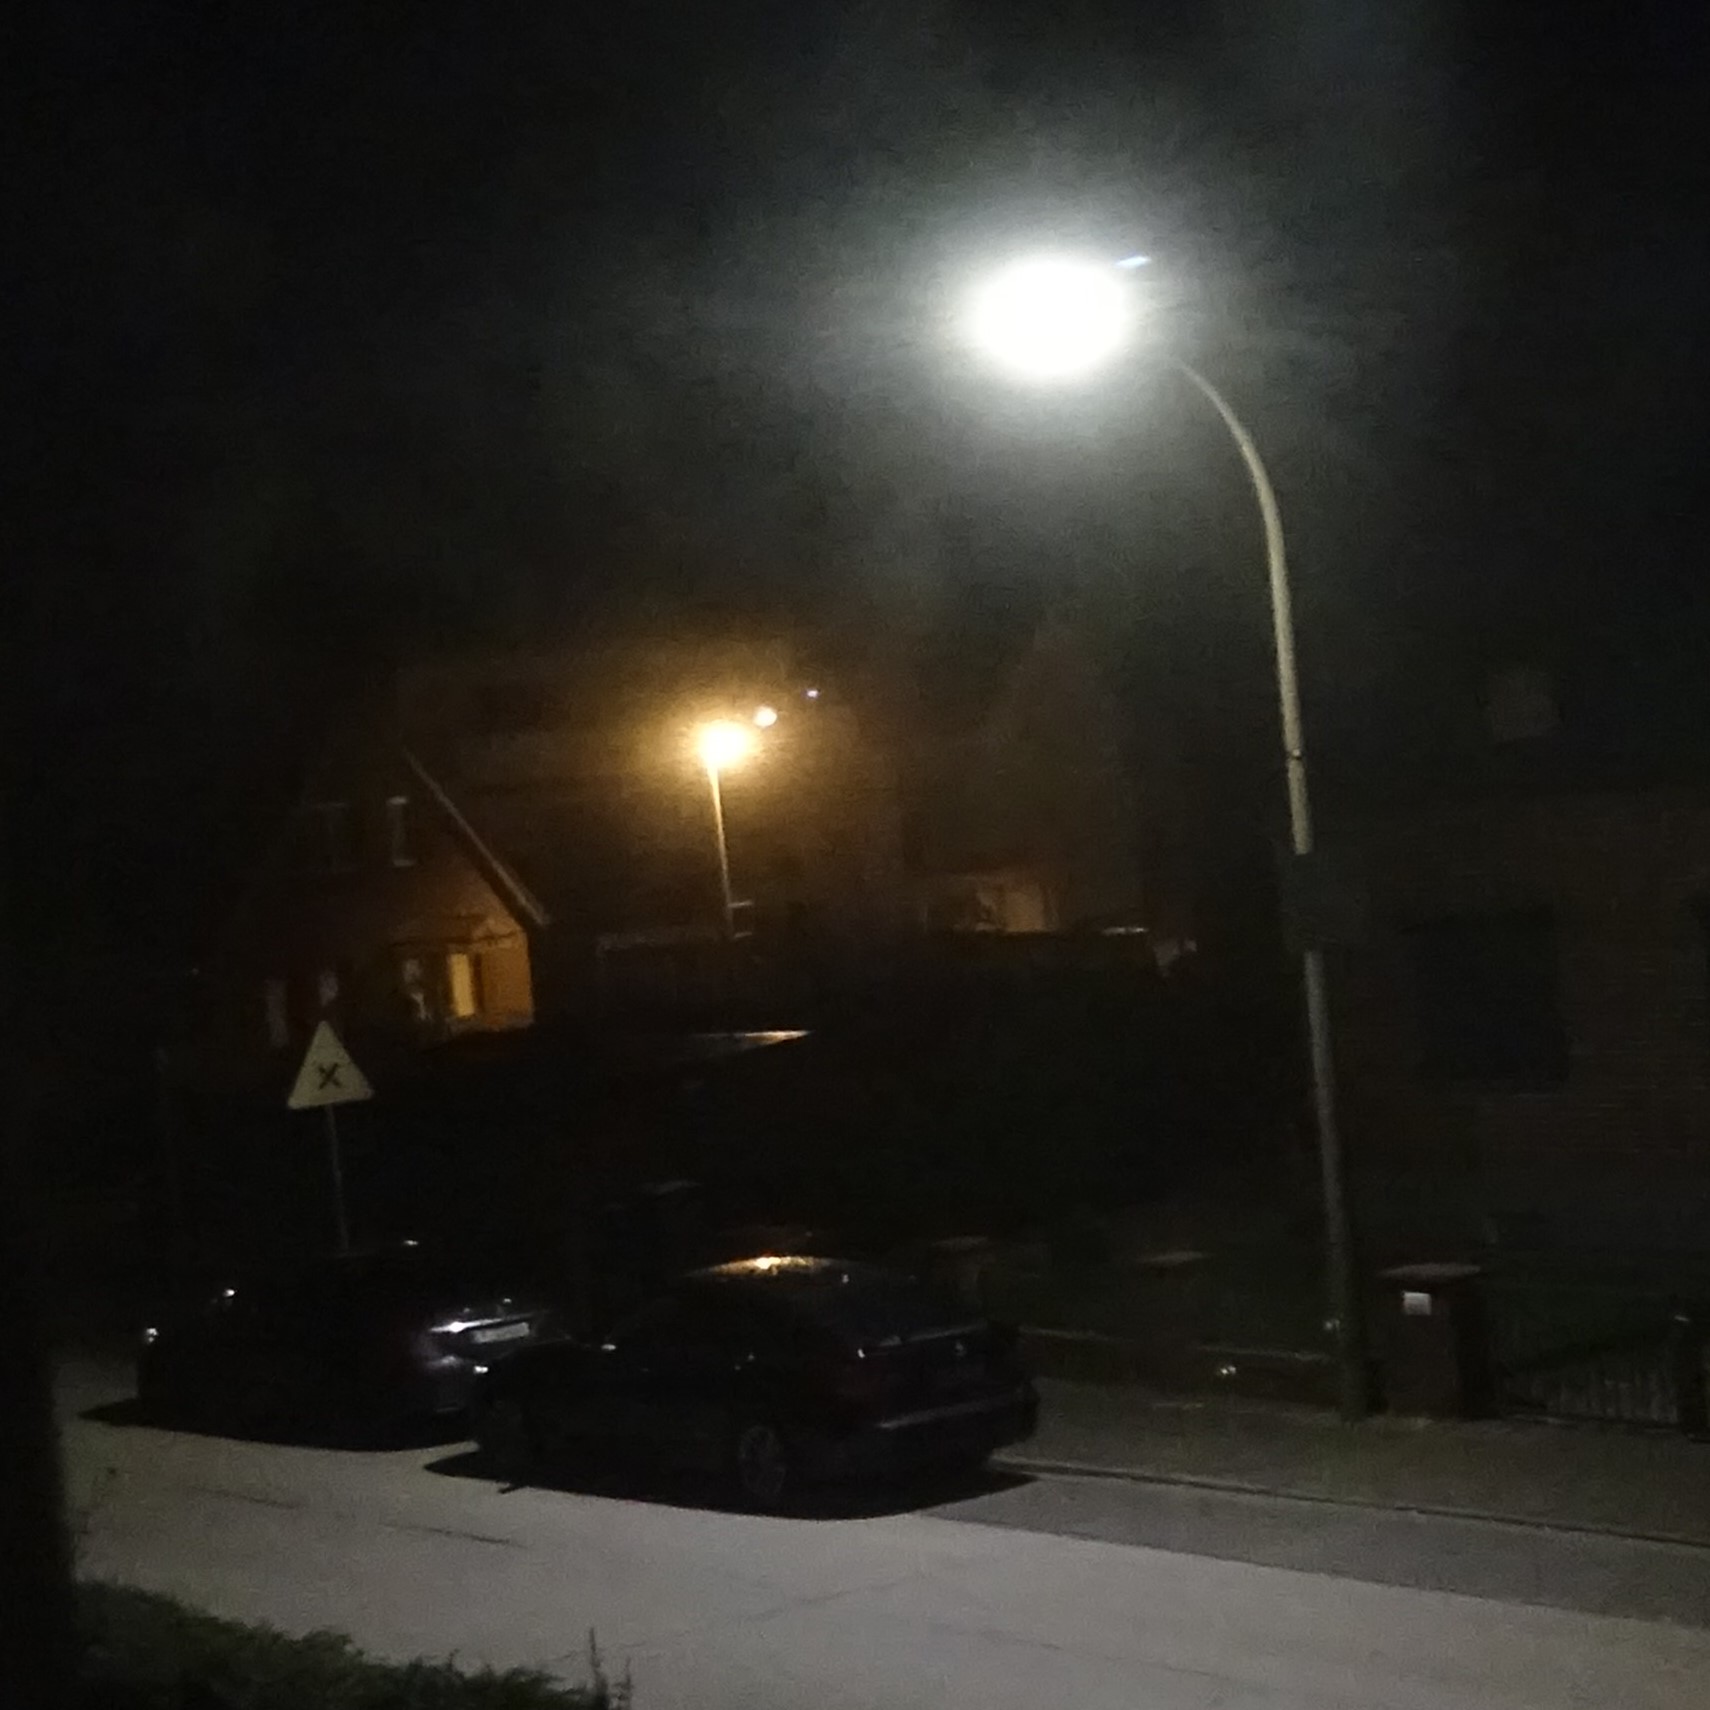
Basic idea: In practice, light sources are a mix (gas discharge, sodium vapor, LED, etc.)—the spectrum reveals the technology.
Measuring outdoors is a teaching goldmine: You combine spectroscopy with environmental issues (light pollution) and learn that »equal brightness« does not mean »equal spectrum.« At the same time, it's a great example of a setup (measuring at a distance).
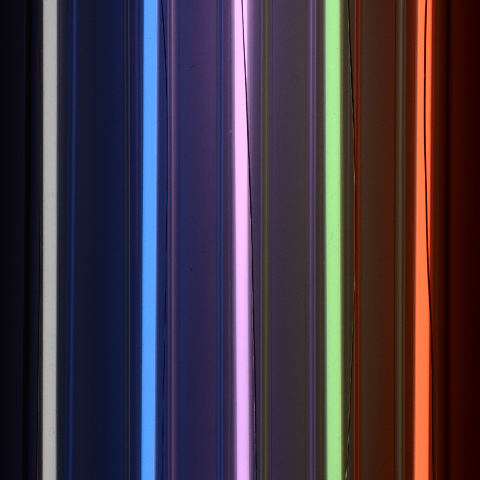
Basic idea: When light sources are combined, their spectra add together—perfect for calibration and »line detection.«
Here, spectroscopy becomes an analytical game: Multiple laser diodes immediately provide reference lines (rough calibration), the superposition of LED and laser demonstrates »spectrum construction,« and the »false line« trains students in true evaluation rather than mere reading.
Here you can easily ask a question or inquiry about our products:
Last update: 2026-07-10

EURECA Messtechnik GmbH
Deutz-Kalker Straße 35, D-50679 Köln
![]()
![]() Phone: +49 (0)221 952629-0
Phone: +49 (0)221 952629-0
Fax: +49 (0)221 952629-9
info(at)eureca.de
www.eureca.de