

 MENU
MENU
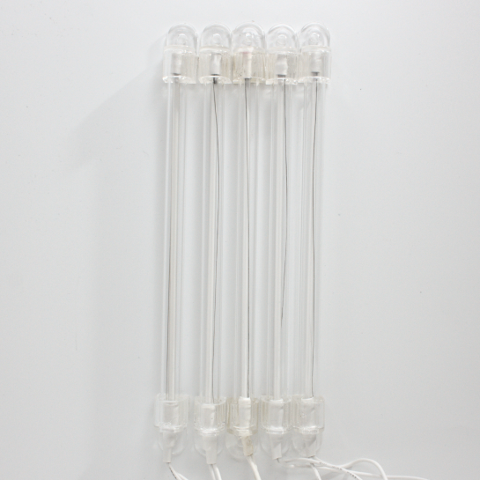
Cold cathode fluorescent lamps (CCFLs) are a type of fluorescent lamp known for their use in the backlighting of LCD screens, for example. They can be manufactured in thin, compact form factors, making them ideal for use in slim display designs. CCFLs use cold cathode electrodes which, unlike hot cathodes, do not need to be preheated. These electrodes are robust and can generate a discharge directly as soon as a high voltage is applied.
An electronic ballast, also known as an inverter, is used to generate the required high alternating voltage, which is typically in the range of several hundred volts. The high voltage applied causes electrons to be emitted from the cold cathode and accelerated by the electric field. The CCFL tube is filled with a noble gas (usually argon) and a small amount of mercury vapor. The accelerated electrons collide with the mercury atoms, ionize them and thus put them into an energized state. The energized mercury atoms then return to their ground state, emitting ultraviolet light mainly in the 254 nm range.
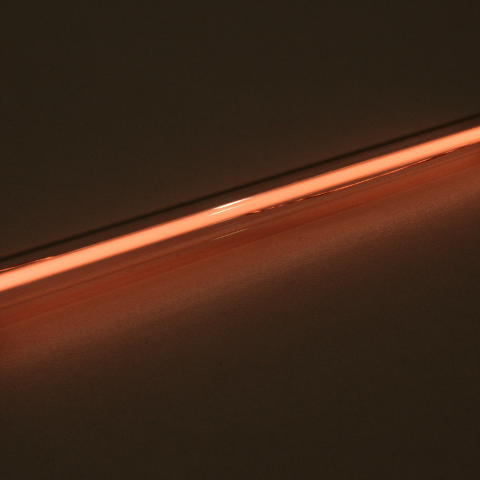
The inside of the CCFL tube has a special fluorescent coating that fluoresces under UV radiation and thus emits visible light in various colors. This light escapes through the walls of the tube and produces very uniform lighting. As CCFL tubes contain mercury, they pose an environmental and disposal problem and are therefore increasingly being replaced by more energy-efficient and environmentally friendly LED technologies.
The argon lines are visible at the start of operation because argon plays an important role as the starting gas in the initial ionization and discharge. During operation, the lamp then gradually heats up, causing more mercury to evaporate and change into the gaseous state. As soon as enough mercury has evaporated, the emission spectrum of the mercury dominates. The argon remains present in the gas mixture, but its spectral lines fade into the background as the mercury emissions are much stronger and provide the bulk of the UV radiation, which is then converted into visible light.
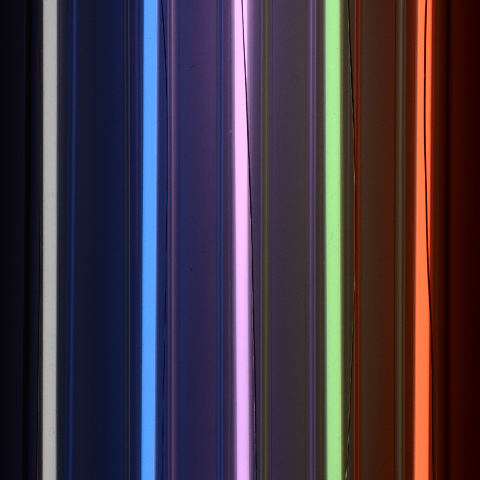
In the following we show a series of spectra of CCFL tubes with different phosphors for the generation of different colors.
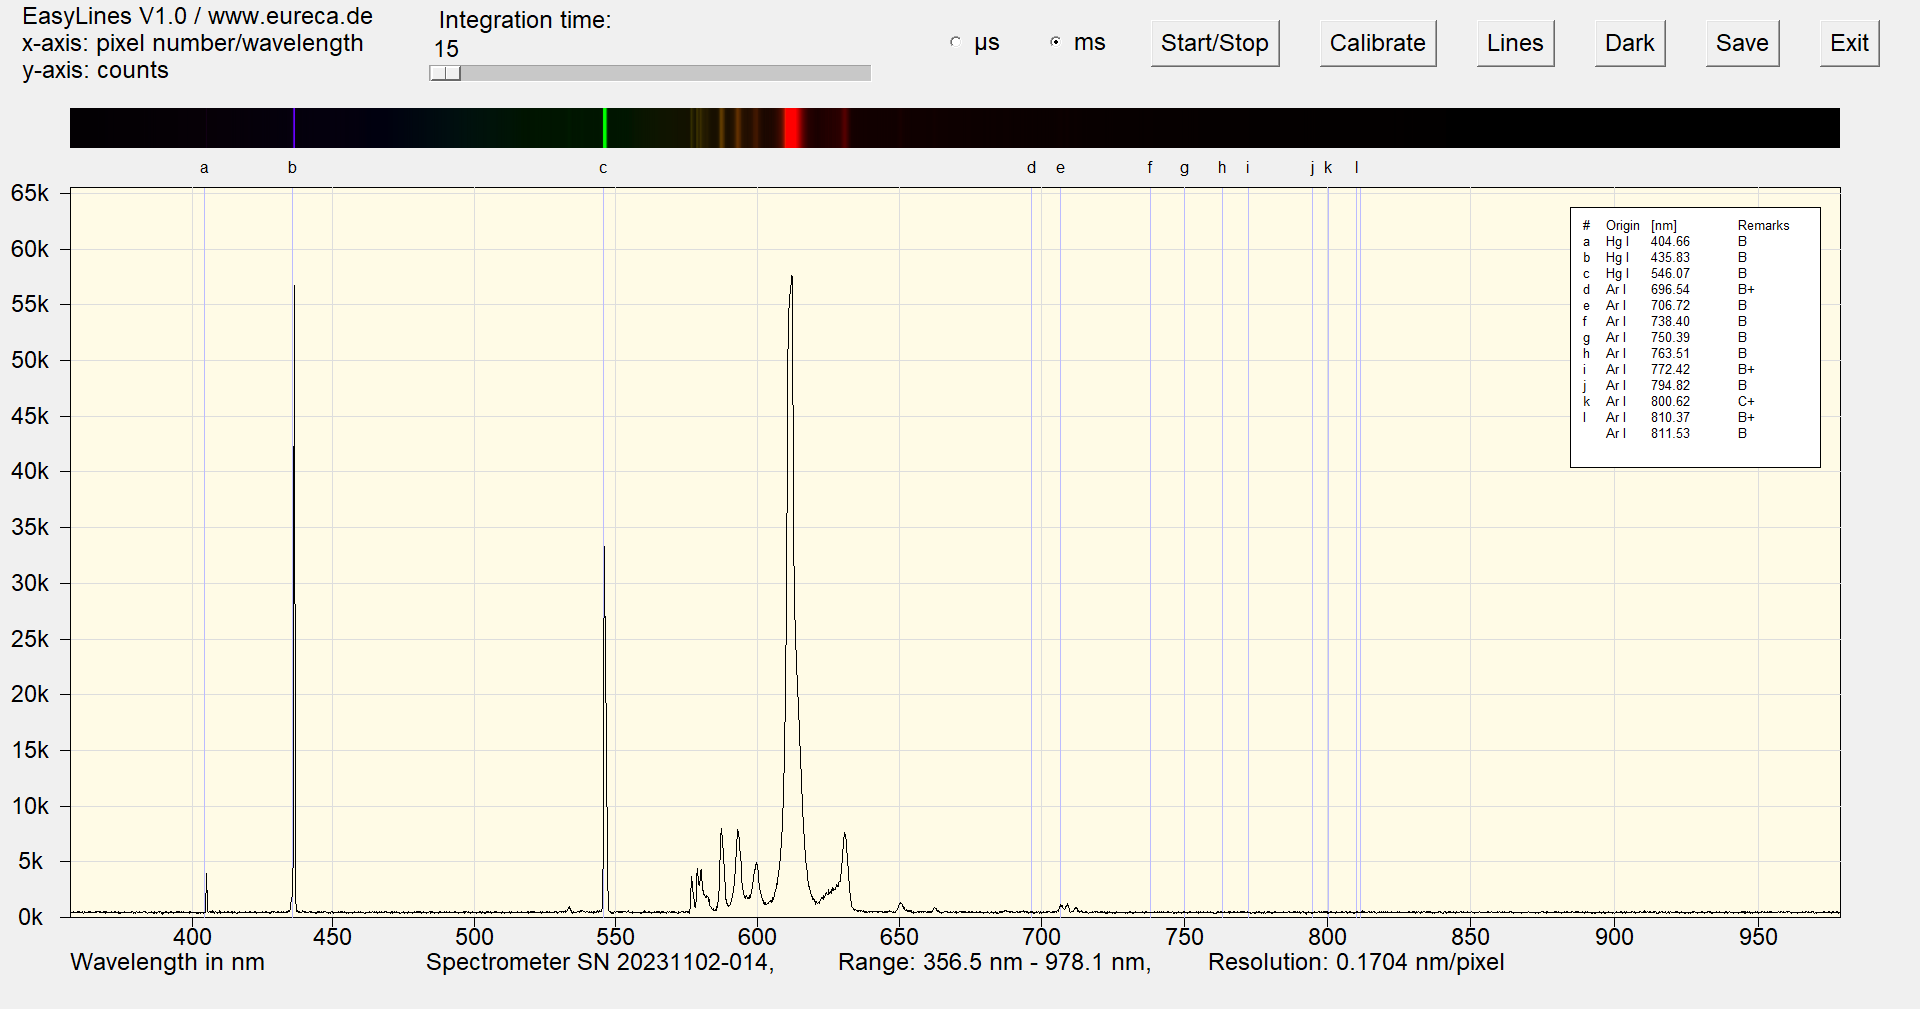
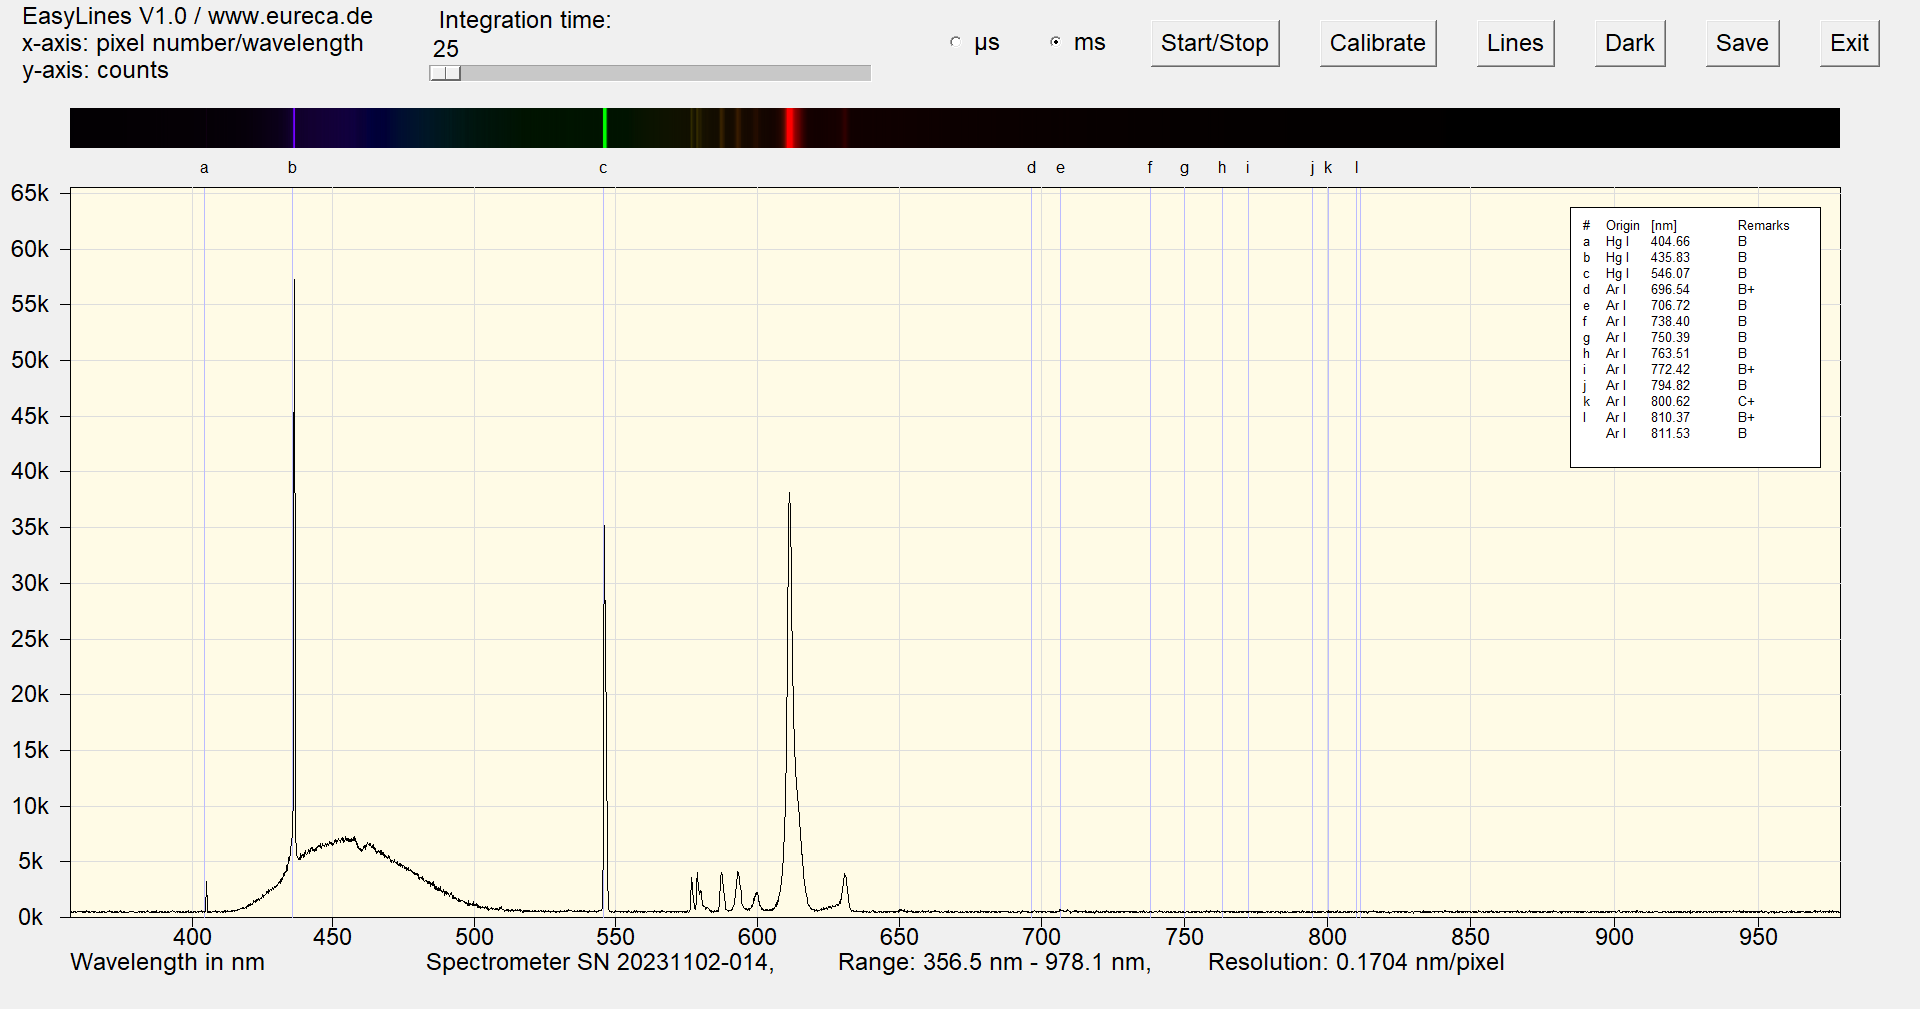
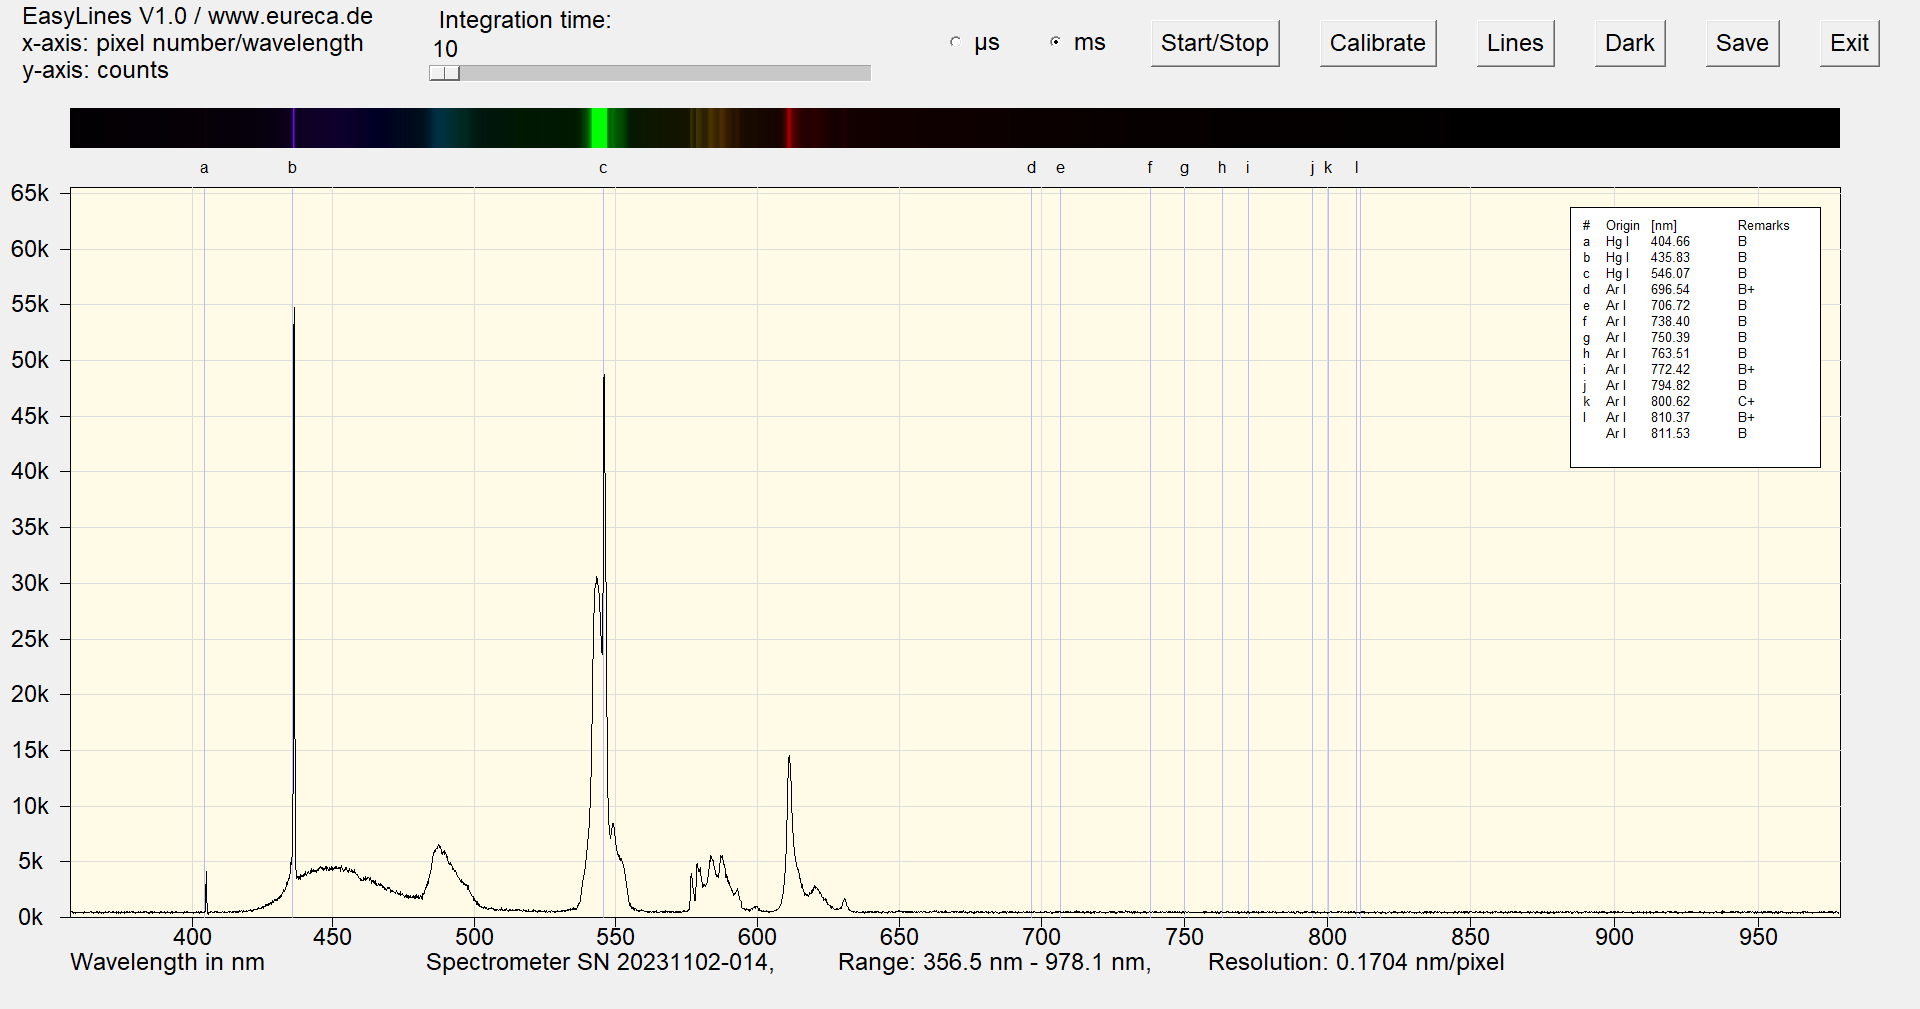
The following image shows the spectrum of a red cold cathode lamp immediately after switching on. In addition to the mercury lines, the argon lines are also clearly visible. However, these disappear within a period of approx. 20 seconds while the lamp reaches operating temperature.
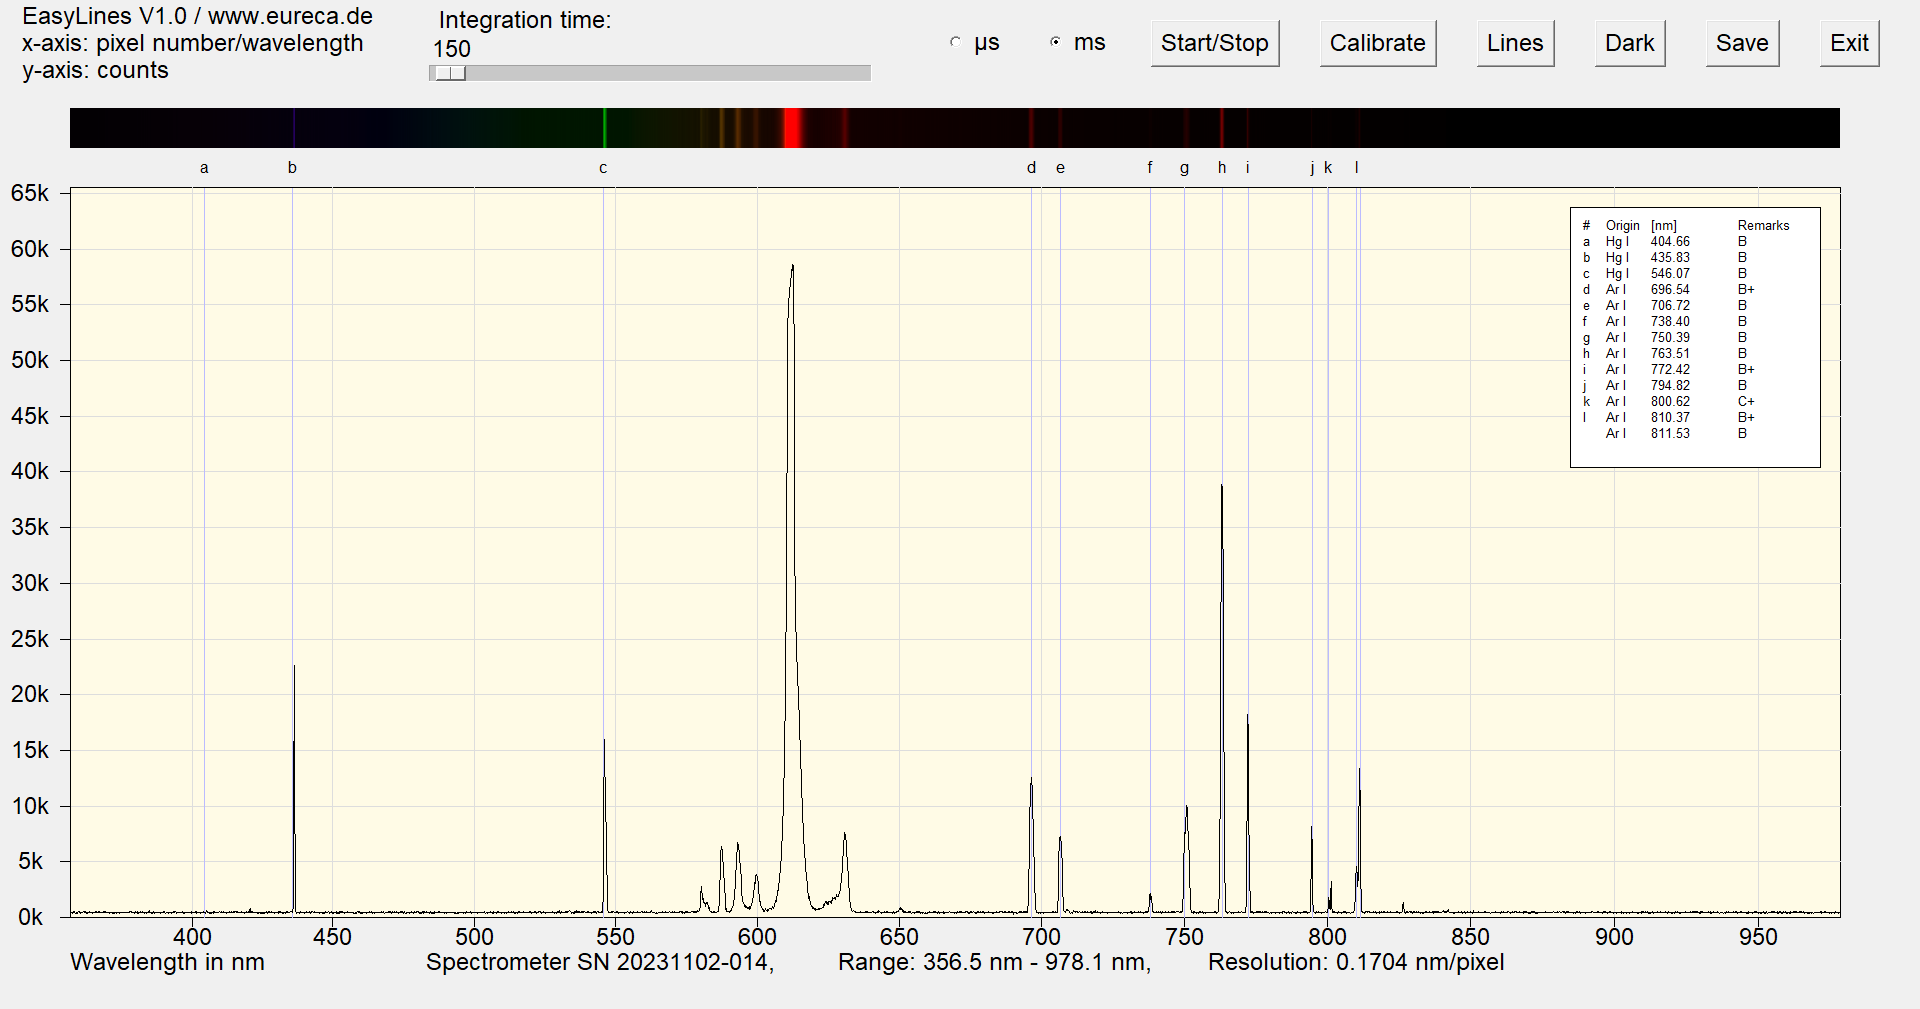
Spectrum of a red cold cathode lamp immediately after switching on with inserted reference values ¹
The following image shows the spectrum of the same cold cathode lamp after approx. one minute of operation. This spectrum does not change even after longer operation. The red color of the CCFL is produced here by a phosphor which, in addition to a strong main emission at approx. 615 nm, also has a series of weaker emissions between 575 nm and 625 nm.
Spectrum of a red cold cathode lamp after approximately one minute of operation with inserted reference values ¹
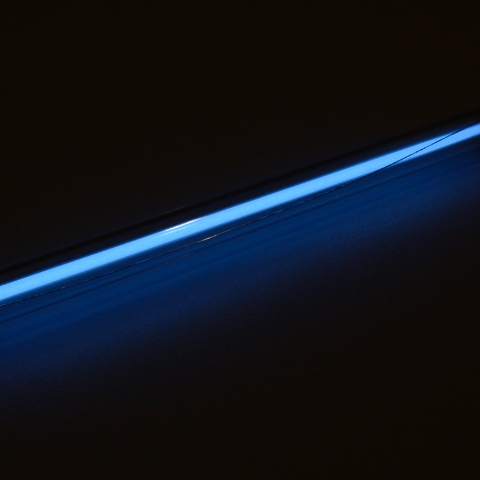
The spectrum again shows the blue CCFL after heating. The spectrum shows only the mercury lines and a relatively broadband emission of a phosphor in the range between 400 – 525 nm.
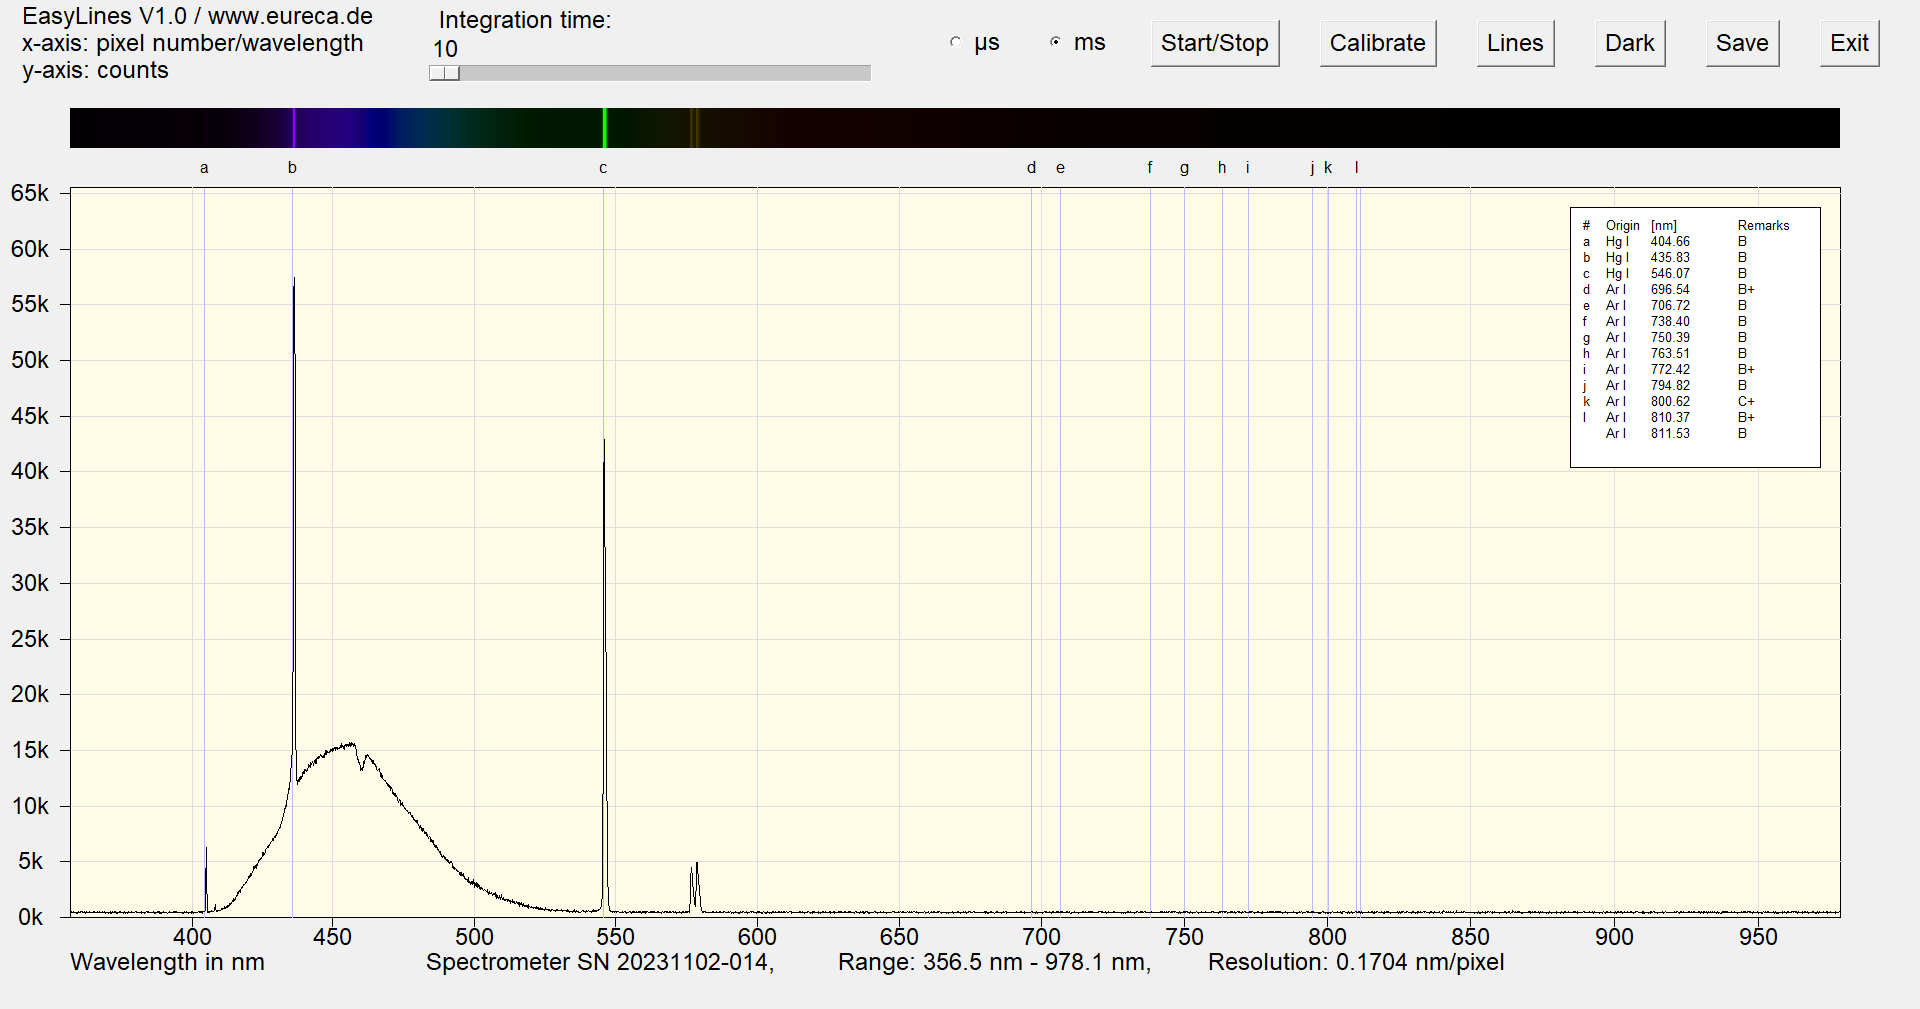
Spektrum einer blauen Kaltkathodenlampe nach etwa einer Minute Betriebsdauer mit eingeblendeten Referenzwerten ¹
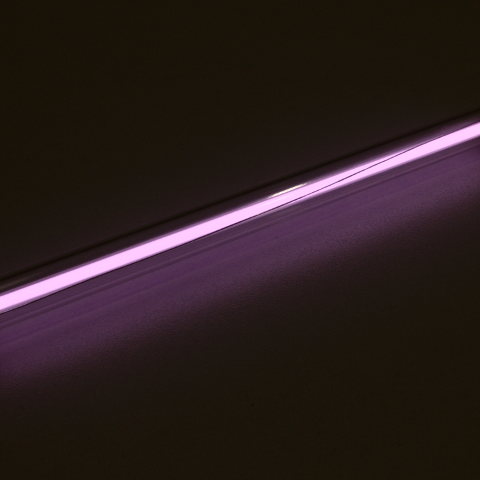
Here, the pink color is produced by a combination of phosphors for blue and red light.
Spectrum of a pink cold cathode lamp after approximately one minute of operation with inserted reference values ¹
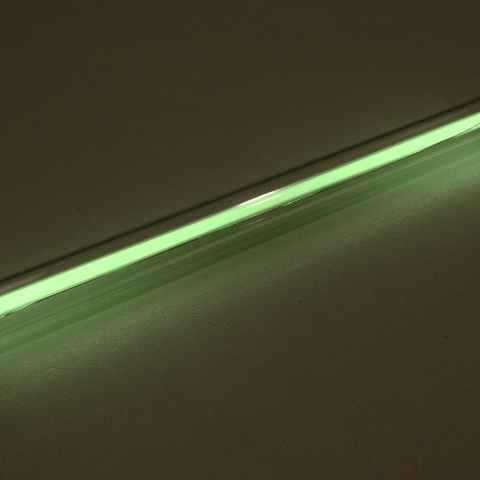
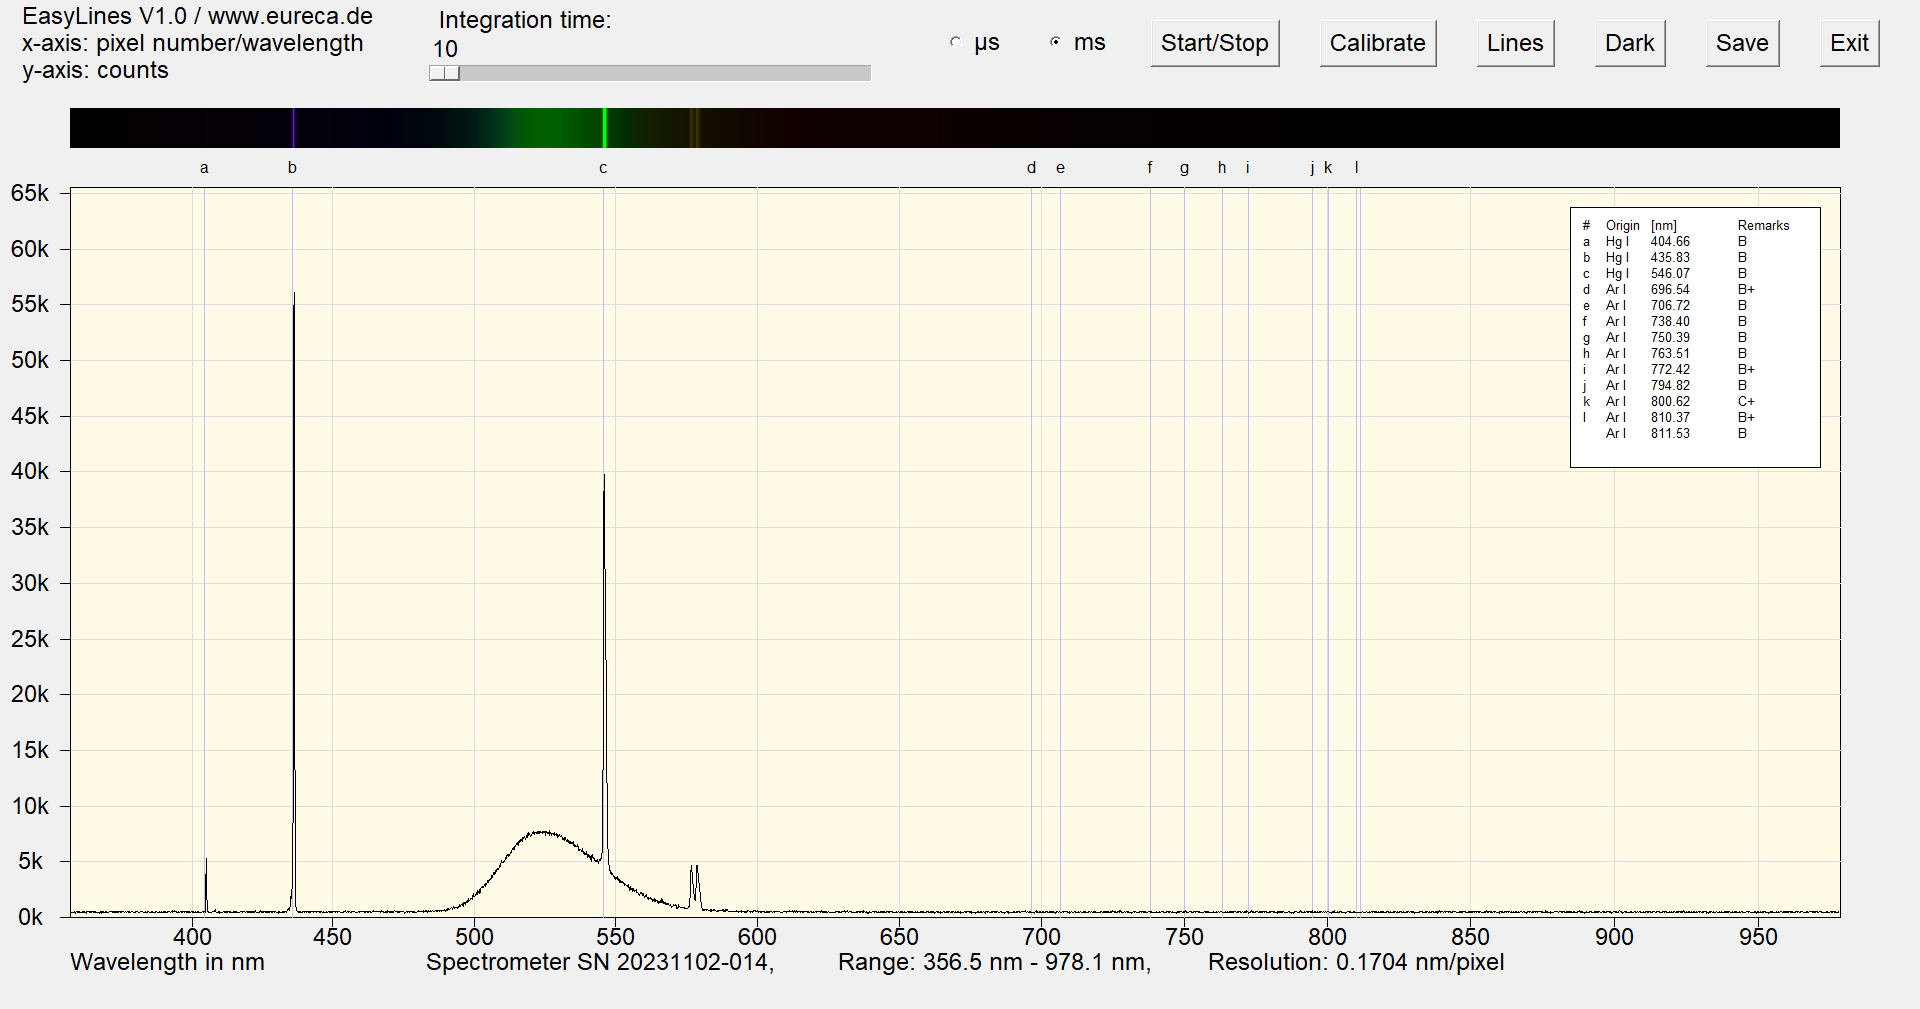
Spectrum of a green cold cathode lamp after approximately one minute of operation with inserted reference values ¹
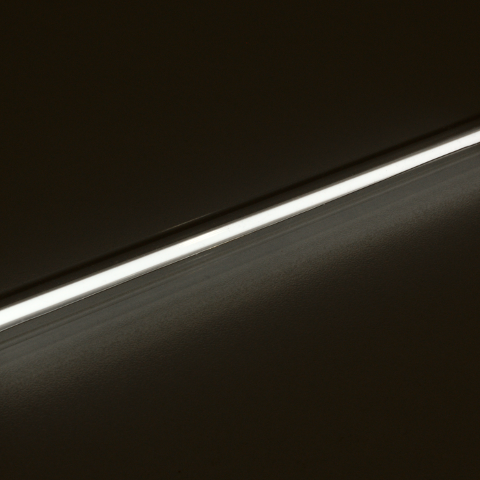
Here, three phosphors are used to produce the mixed color white from the primary colors blue, green and red.
Spectrum of a white cold cathode lamp after approximately one minute of operation with inserted reference values ¹
¹ The spectra were recorded with the Czerny-Turner spectrometers from our optoelectronic consctruction kit.
The data of the superimposed emission lines are from the Atomic Spectra Database | NIST.
Kramida, A., Ralchenko, Yu., Reader, J., and NIST ASD Team (2023). NIST Atomic Spectra Database (ver. 5.11), [Online]. Available: https://physics.nist.gov/asd [2024, June 23]. National Institute of Standards and Technology, Gaithersburg, MD. DOI: https://doi.org/10.18434/T4W30F
 Would you like to replicate the experiment—in your laboratory or teaching environment? Feel free to contact us—we will assist you with planning, setup, calibration, and selecting the right components. Eureca offers advice based on many years of expertise in optoelectronics, optics and spectroscopy—from DIY setups to OEM solutions. Feedback is expressly welcome: Please share your experiences, results, or suggestions for improvement with us.
Here you can easily ask a question or inquiry about our products:
Last update: 2025-10-30

EURECA Messtechnik GmbH
Deutz-Kalker Straße 35, D-50679 Köln
![]()
![]() Phone: +49 (0)221 952629-0
Phone: +49 (0)221 952629-0
Fax: +49 (0)221 952629-9
info(at)eureca.de
www.eureca.de


