

 MENU
MENU
This application description uses recorded spectra to show how different colors are produced in fireworks. Spectral experiments on fireworks are particularly popular with pupils and students because they are perceived as »cool«. This results in a high level of acceptance in practical courses, while at the same time the students learn a lot about emission lines of atomic origin or molecular bands.

Emission lines of atomic origin normally appear as narrow peaks in the spectrum. This is due to the physical properties of the atomic transitions, as atoms have clearly defined, discrete energy levels. The transitions between these levels lead to emissions at specific wavelengths, resulting in narrow, well-defined lines in the spectrum. Although the lines can be split by effects such as fine structure (e. g. spin-orbit coupling), they generally remain very narrow and easily distinguishable in the spectrum. Examples in firework spectra are the emission lines of potassium and sodium.
However, there are also physical processes that can widen these narrow lines. The thermal movement of the atoms in a hot firework flame can cause the lines to widen slightly. Atoms moving towards or away from the observer or camera produce a blue or red shift, which also broadens the line. Collisions between atoms or molecules in the dense flame lead to a further broadening of the emission lines. In a firework flame, which consists of a complex plasma, high densities can also cause further broadening effects.
Ultimately, however, the width of the recorded emission lines also depends on the resolution of the spectrometer used, which is influenced by the slit size used and the quality of the optical components, among other things. A spectrometer with a low resolution can widen even narrow lines and cannot cleanly resolve lines that are too close together.
Molecules, on the other hand, have rotating and vibrating states in addition to the electronic transitions. These lead to band spectra with broad and complex structures. Examples are the characteristic broad green emissions of barium chloride or the bluish emissions of copper halides.
One of our DIY spectrometers with fiber optic coupling and the following data was used to record the spectra:
For our measurements, table fireworks of category F1 were used, namely fountains with the burning colors red, green, blue, yellow, violet and a burning time of up to 60 seconds each. These were fixed outdoors with the aid of a stable clamp and the light guide to the spectrometer was positioned at a distance of around 2 cm in front of the fountains' outlet opening. A suitable test tube was placed over the light guide to protect it, so that the light guide looked through the bottom of the test tube onto the flame of the fountain.
When experimenting with fireworks, it is essential that all necessary safety precautions are observed. Measurements can be carried out without any problems with category F1 table fireworks, which can be purchased and used all year round. Nevertheless, even these can cause serious injury or damage if handled carelessly.
Due to the dynamics of the burning flames, it is difficult to obtain a stable signal for a targeted single exposure. For this reason, a series of several images were taken in succession, from which a suitable image was then selected for the comparison of the individual colors.
It is also advisable to use inexpensive light guides (e. g. TosLink), as burning fireworks often develop an unpredictable life of their own and the heat generated by firework fountains should not be underestimated, even at a distance of a few centimeters during longer burning times.
The spectra shown represent the raw data from the spectrometer, for which no spectral corrections were made to the measured intensities. Therefore, the height of the peaks in the spectrum cannot be directly equated with the visible intensities of the respective colors. For this, both the spectral sensitivity of the human eye and that of the sensor used in the spectrometer would have to be taken into account. However, this is not necessary for understanding the formation of firework colors.
The theoretical positions of the central wavelength of emission peaks of atomic origin are shown in the recorded spectra. In the case of emission bands originating from molecules, the edge positions are shown, whereby the band itself then extends either into the long-wave or the short-wave range. The values used are taken from the NIST database for atomic spectra as well as from the standard work »The Identification of Molecular Spectra«.
Kramida, A., Ralchenko, Y., Reader, J., & NIST ASD Team. (2023). NIST Atomic Spectra Database (ver. 5.10). [Online].
Available: https://physics.nist.gov/asd [Accessed: January 21, 2025]. National Institute of Standards and Technology, Gaithersburg, MD.
Pearse, R. W. B., and A. G. Gaydon. The Identification of Molecular Spectra. 4th ed., Chapman and Hall, 1976.
Herzberg, G.: Molecular Spectra and Molecular Structure I: Spectra of Diatomic Molecules (1950).
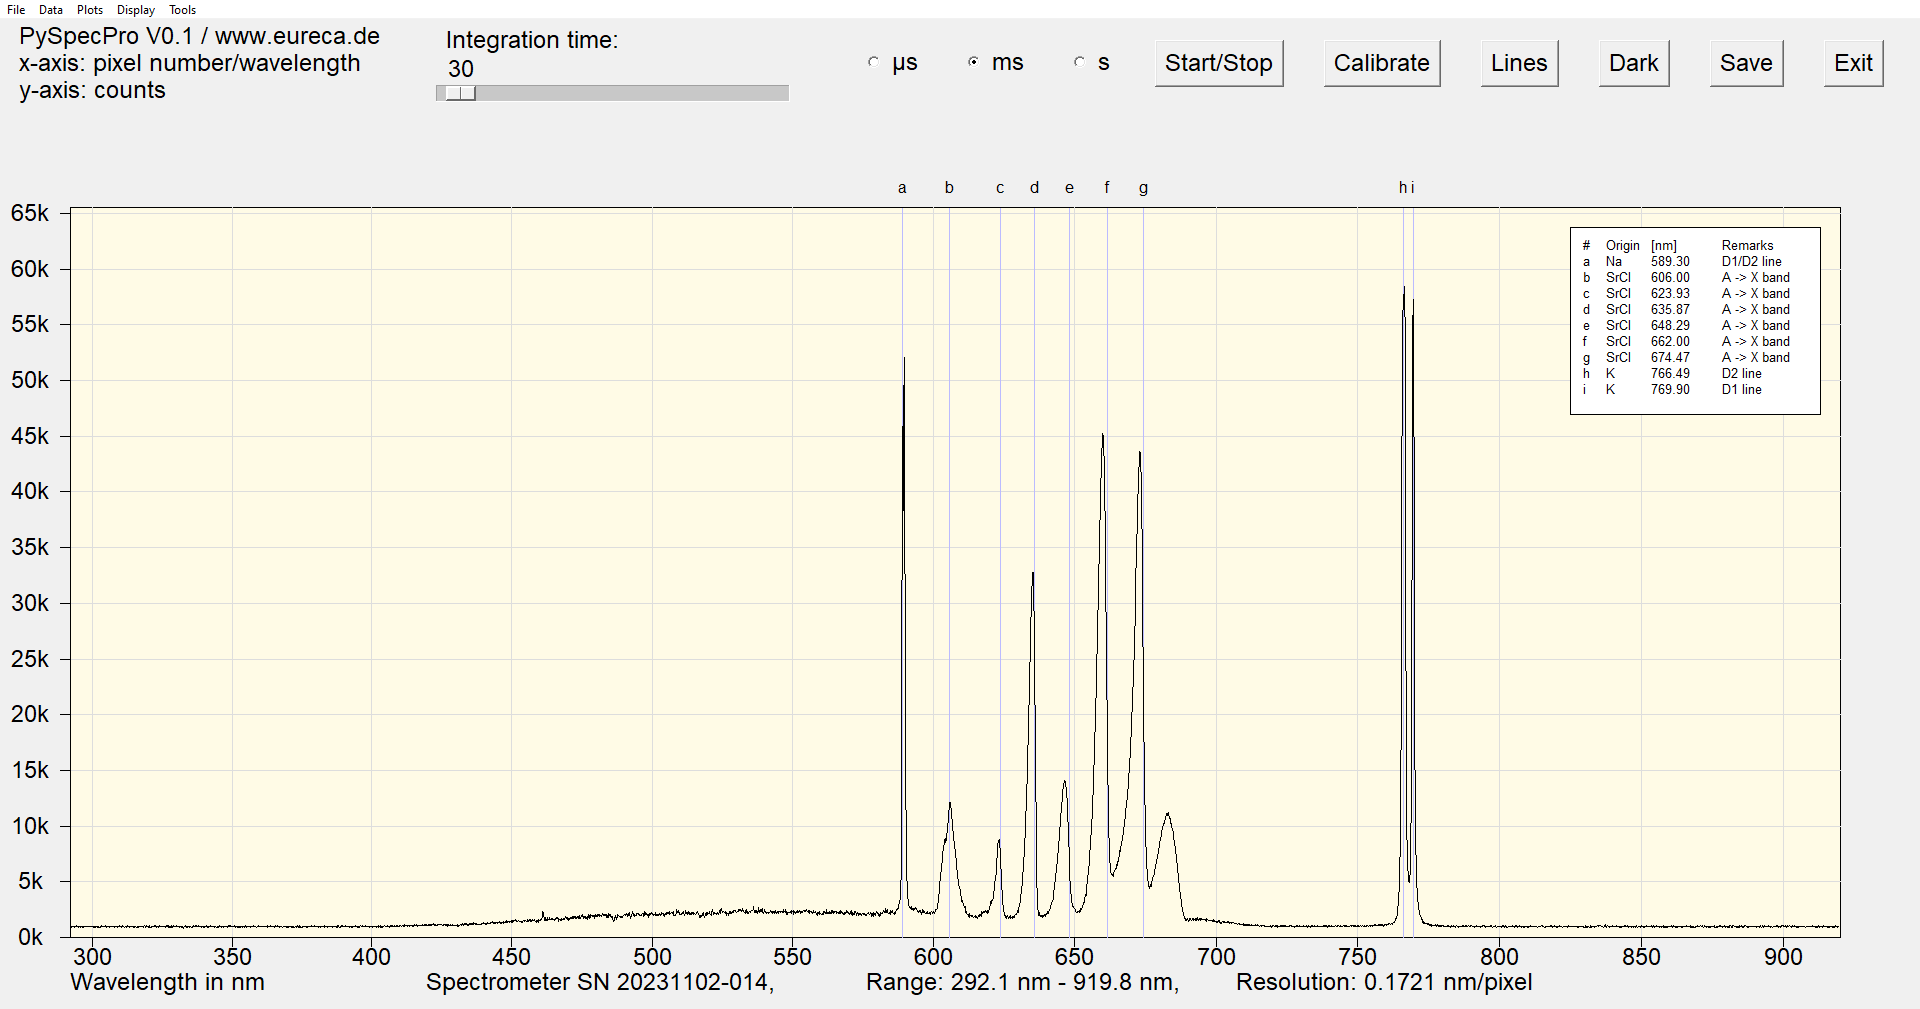
The spectrum of the yellow fountain is dominated by the sodium D line at approx. 589.3 nm, which is known for its characteristic yellow-orange color. This results from electron jumps in the sodium atom, more precisely from the transition from the energized state 3p to the ground state 3s.

The sodium D line actually consists of two closely neighboring spectral lines, which are created by fine structure splitting due to the spin-orbit coupling of the electron: the D1 line at 589.6 nm and the D2 line at 589.0 nm. However, this small distance between the lines cannot be resolved by the spectrometer used, so that only a single line is detected.
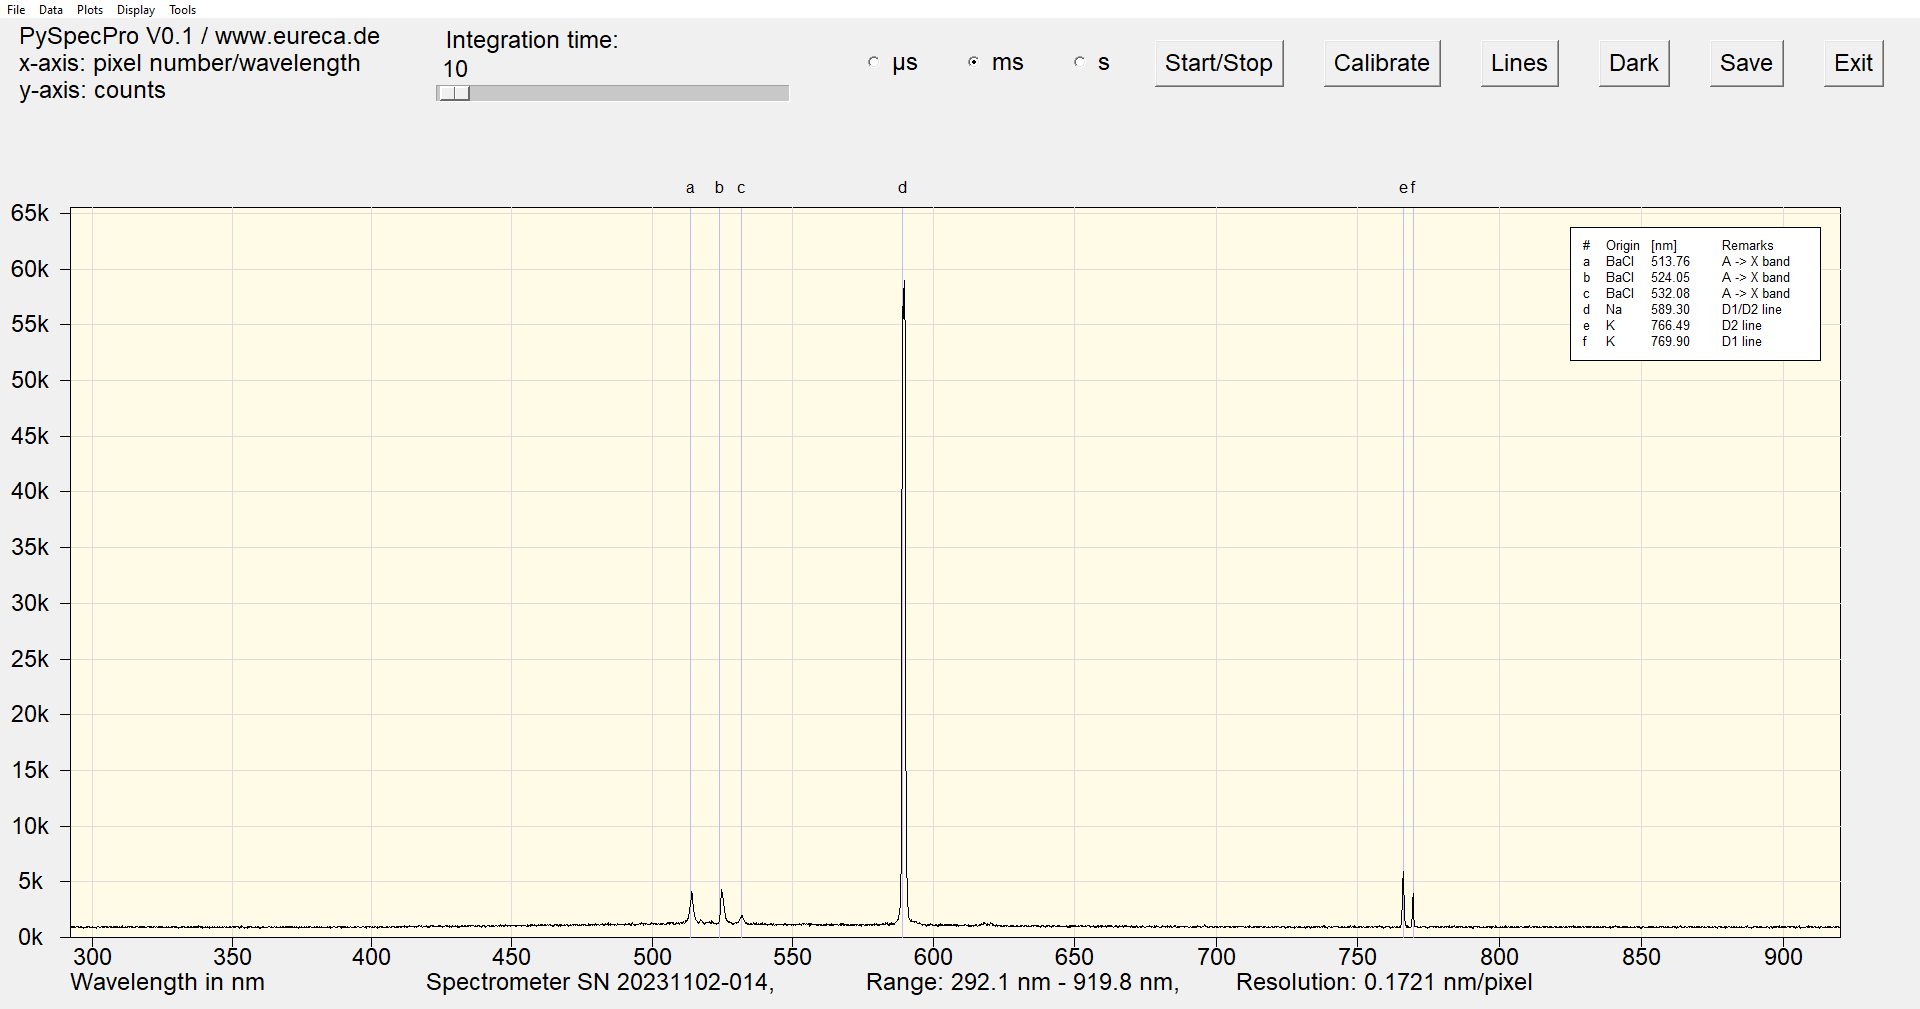
Spectrum of a yellow fountain with inserted reference values
The sodium D-line appears in almost all recorded spectra of fireworks, even if no sodium-containing compounds have been deliberately added. Sodium is one of the most common elements in the earth's crust and is therefore often present as an impurity in the materials used, such as pyrotechnic chemicals, binders, paper, adhesives or metal salts.
In addition, the sodium D line is extremely strong and prominent because the transition between the 3p and 3s states has a very high transition probability. Even the smallest amounts of sodium can therefore produce a visible yellow line in the spectrum. The excitation energy for sodium is also relatively low at around 2.1 eV, so that even low temperatures or small amounts of energy in the flame are sufficient to ionize sodium atoms and produce their characteristic emission. Even if other elements are also present in the fireworks, the yellow line will therefore often be more clearly visible.
Furthermore, there are also lines of potassium in the spectrum at approx. 766.5 nm and 769.9 nm. This is not surprising, as potassium chlorate or potassium perchlorate is an essential component of fireworks. As one would expect from emission lines of atomic origin, the corresponding peaks are very narrow. However, the potassium lines do not contribute to the coloration of the flame, as they lie outside the wavelength range that our eyes can detect (from violet at 400 nm to red at approx. 750 nm).
Finally, there is a series of lines in the green spectral range that originate from barium salts. The color of the yellow fountain is thus created here by a clever combination of yellow-orange and green in suitable intensities.
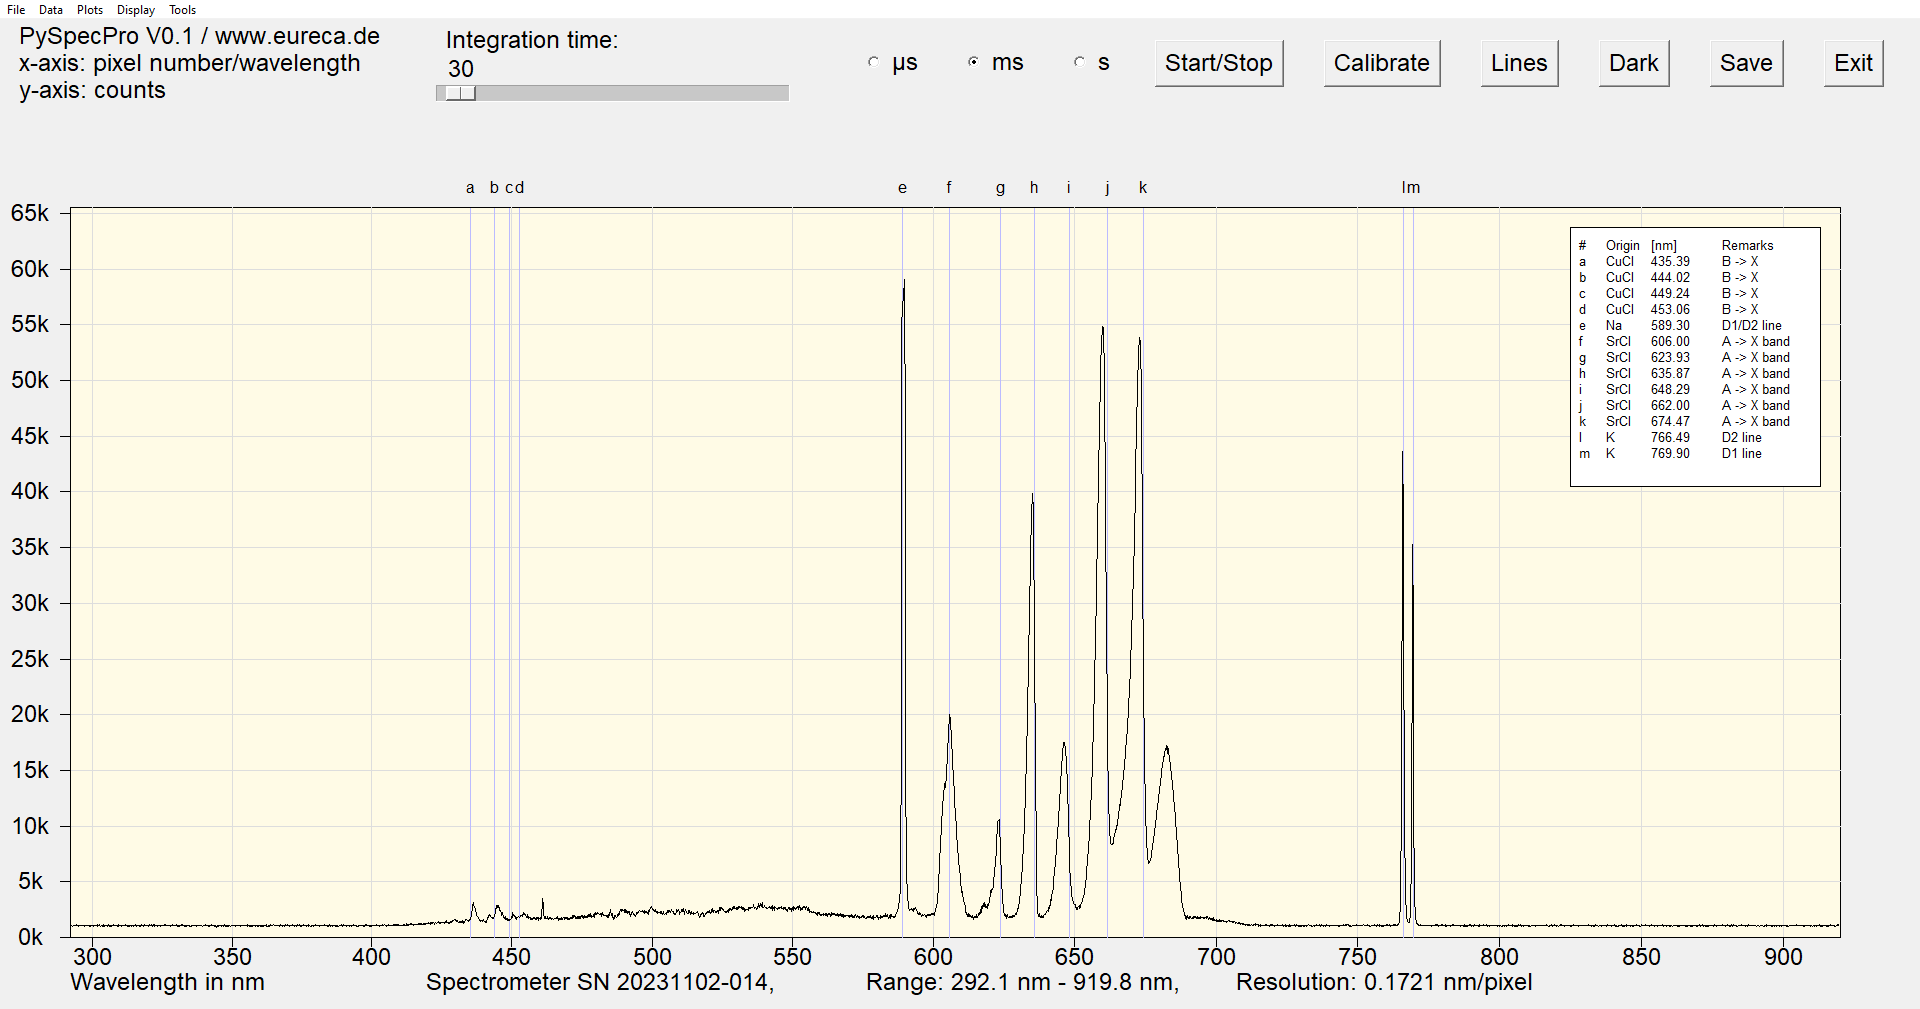
In the recorded spectrum, the typical emission lines of atomic potassium can be seen again at approx. 766.5 nm and 769.9 nm. The sodium D line is of course also included in the spectrum again, but here it is no longer as dominant as in the yellow fountain.
However, the green color of the fountain comes from a series of typical barium lines in the range of 505 nm and 555 nm, which originate from the BaCl molecule.
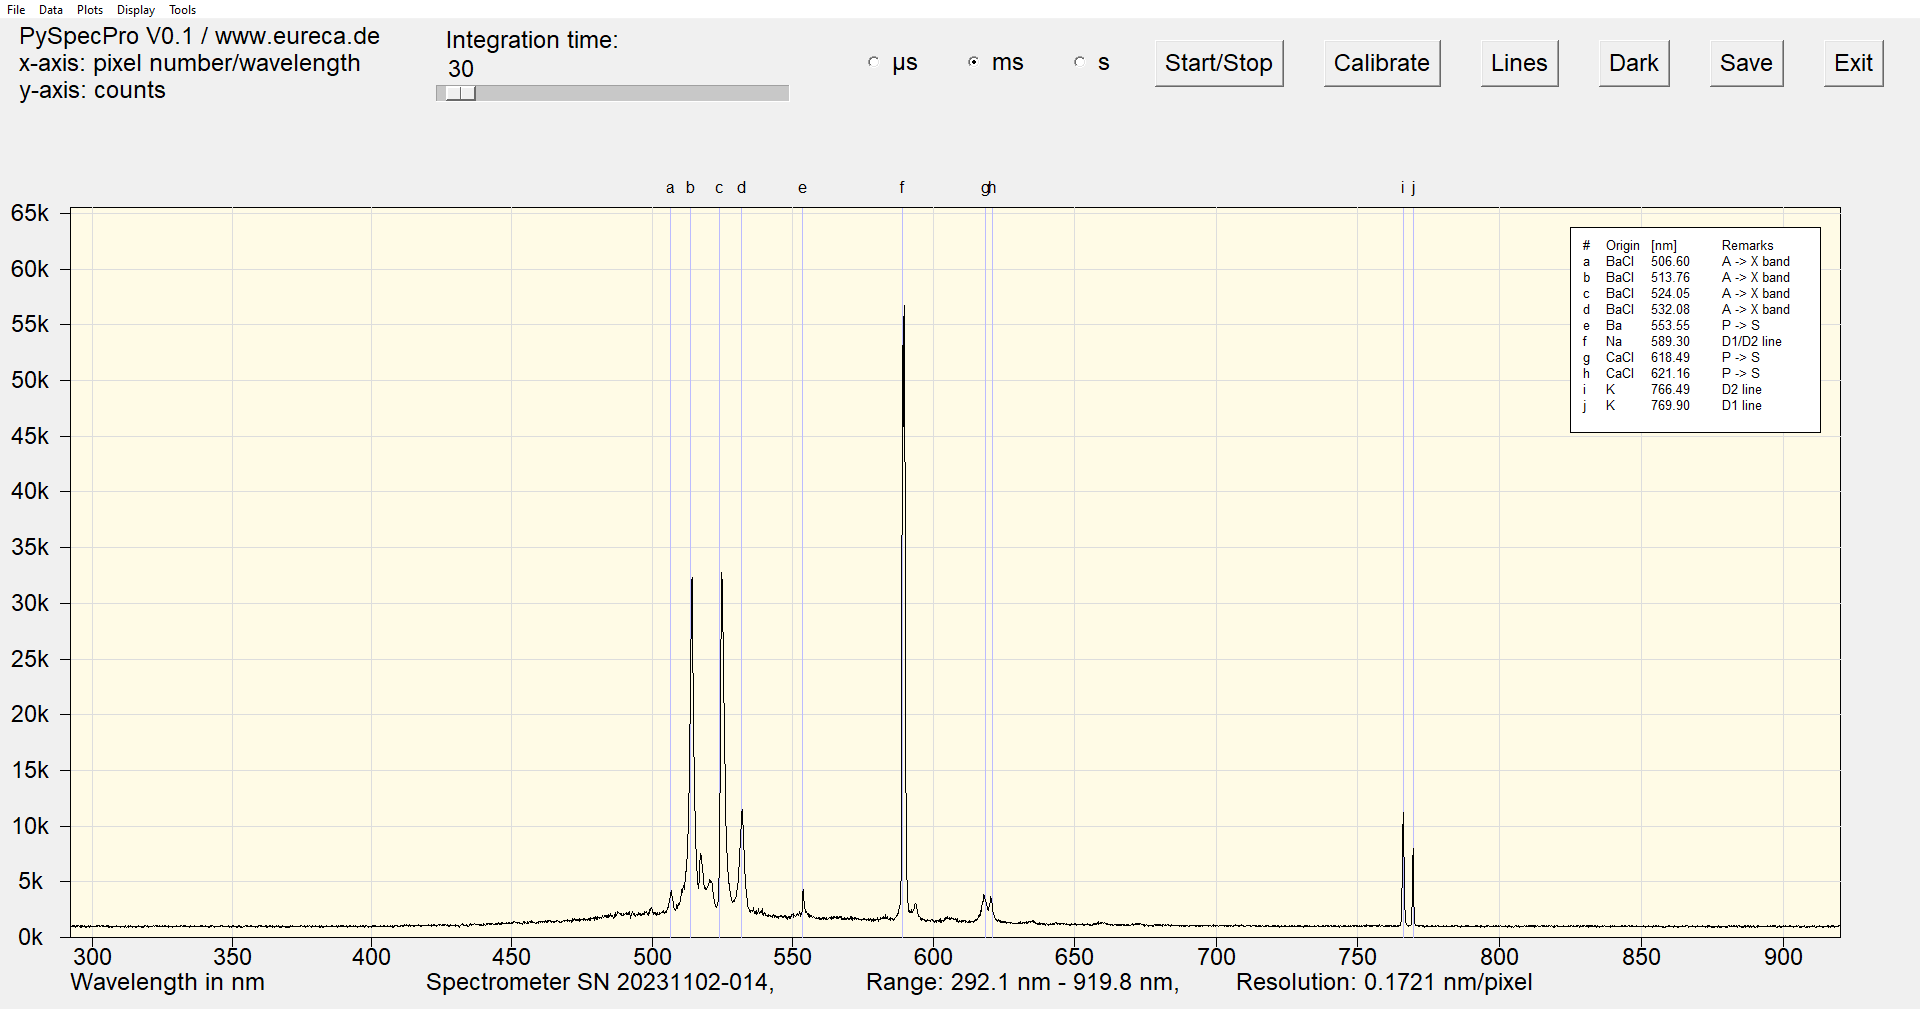
Spectrum of a green fountain with inserted reference values
Interestingly, there are also lines of lower intensity in the spectrum, which presumably originate from CaCl. Either this was intentionally added to add a slight brick-red to orange-red note to the green color of the fountain, or it is an impurity from the manufacturing process of the otherwise used chemicals.
The recorded spectrum of the blue firework shows peaks in the range from 420 nm to 510 nm, which are characteristic of the emission of copper atoms and copper compounds. Copper compounds such as copper(I) chloride, but sometimes also copper(II) chloride or copper sulphate are used in blue fireworks, as they produce intense and stable blue colors.

Copper lines are clearly visible as copper has a high tendency to emit when it is excited. The intensity of the lines depends strongly on the temperature of the flame, as higher temperatures lead to stronger excitation of the electrons. Blue is particularly difficult to produce in pyrotechnics as the blue color reacts sensitively to the temperature of the flame. If temperatures are too high, the blue light from copper is outshone by other colors (e. g. green from copper(II) oxide or orange from combustion products). It is therefore important to precisely control the composition and burning temperature of the fireworks to ensure that the blue color is stable and pure.
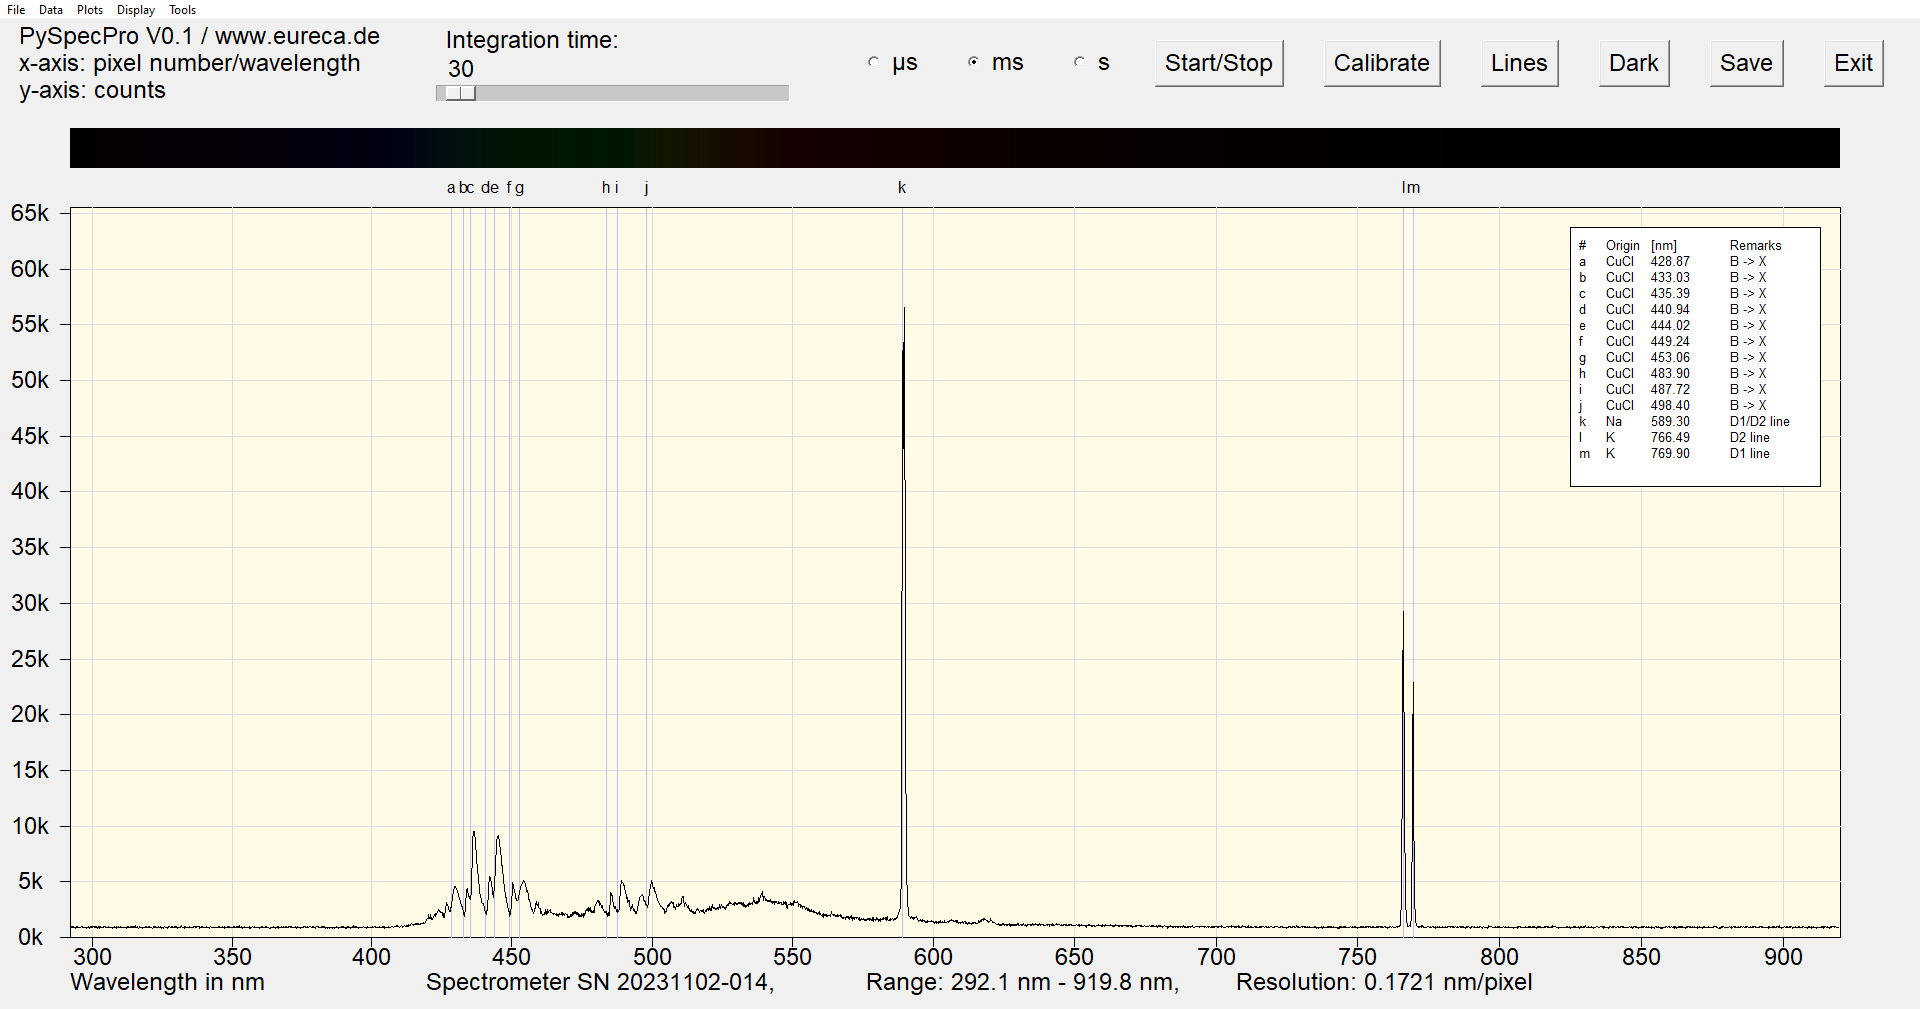
Spectrum of a blue fountain with inserted reference values
The theoretical values given in the spectrum originate from precise measurements of CuCl spectra. Deviations in the observed values can be caused by the temperature in the fireworks, pressure conditions or Doppler shift.
The spectrum of the red fountain is dominated by a large number of bands originating from strontium salts. Unlike barium or copper, which often show clearer and less overlapping lines, strontium has a variety of energy levels that lead to the observed bands.

Only some of the theoretical positions of the observed bands are noted in the legend. Strontium has a rather complex structure of the electron shell, which leads to many transitions. This multitude of transitions makes it difficult to clearly assign the lines. In addition, a firework can contain various chemical compounds and accompanying substances that further complicate the spectrum.
Spectrum of a red fountain with inserted reference values
The violet color of a corresponding fountain is created by combining red bands from strontium salts with blue emissions from copper salts.

Spectrum of a violet fountain with inserted reference values
 Would you like to replicate the experiment—in your laboratory or teaching environment? Feel free to contact us—we will assist you with planning, setup, calibration, and selecting the right components. Eureca offers advice based on many years of expertise in optoelectronics, optics and spectroscopy—from DIY setups to OEM solutions. Feedback is expressly welcome: Please share your experiences, results, or suggestions for improvement with us.
Here you can easily ask a question or inquiry about our products:
Last update: 2025-10-31

EURECA Messtechnik GmbH
Deutz-Kalker Straße 35, D-50679 Köln
![]()
![]() Phone: +49 (0)221 952629-0
Phone: +49 (0)221 952629-0
Fax: +49 (0)221 952629-9
info(at)eureca.de
www.eureca.de


