

 MENU
MENU
Here we present our latest sample spectra recorded with our DIY spectrometer. This time we have dedicated ourselves to the fascinating fluorescent colors of the Liqu-ment series from Colorberry. The intense colors neon green, neon yellow, neon tangerine, neon orange, neon pink and neon purple were analyzed under excitation with a 275 nm LED and reveal impressive spectra that make the luminosity of the fluorescent colors visible.
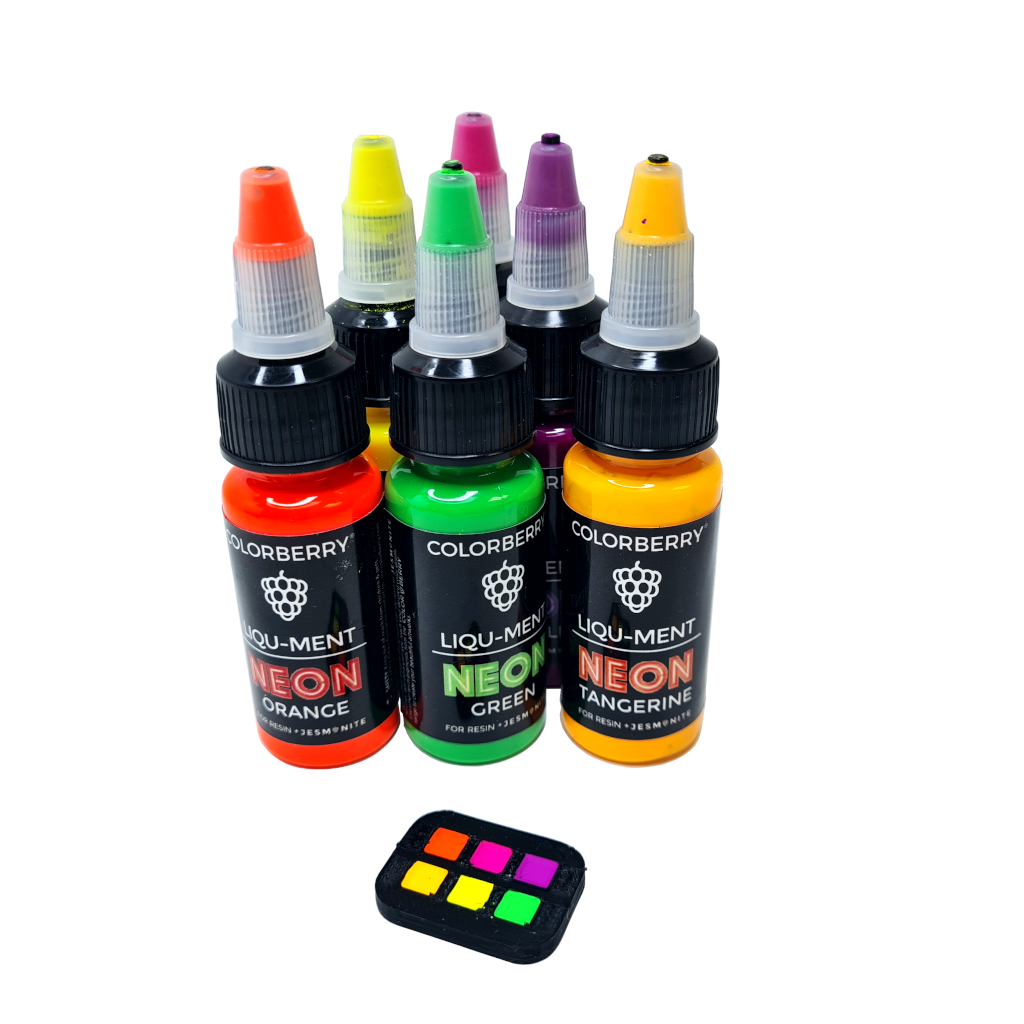
The Liqu-ment paints from Colorberry are not only extremely bright, but also highly pigmented, which means that they can produce an intense coloration with just a few drops. These water-based paints are environmentally friendly and have been specially developed for coloring casting materials such as JESIN or ceramic casting powder. Their bright neon colors such as Neon Pink, Neon Yellow and Neon Green are particularly eye-catching and are ideal for creative projects that require fluorescent effects.
The fluorescence on which these colors are based is the result of a physical process in which molecules absorb light of a certain wavelength and then re-emit light of a different, longer wavelength. When excited with the 275 nm LED, the fluorescent molecules in the Liqu-ment colors absorb the high-energy ultraviolet light and emit it again as intense, colored light.
The fluorescence spectra shown below were recorded with one of our DIY spectrometers in Czerny-Turner design and 100 mm mirror focal length. We had already used this for recording the fluorescence of minerals, as this relatively small focal length makes it very easy to increase the sensitivity of the spectrometer even for weak signals (albeit at the expense of resolution).
The raw data of the sensor (TCD1304DG with 3648 pixels) are shown after spectral calibration using a green glow lamp. The range of 36.6 – 966.5 nm shown under the spectra is the theoretically possible spectral range that the sensor could detect in this configuration. However, it is actually only sufficiently sensitive in the range of approx. 400 – 870 nm. The neon colors were applied to a black background and allowed to dry. During the measurement, the 275 nm LED was irradiated at an angle of 45 degrees from a distance of a few millimeters, whereby the fluorescent signal was also recorded at an angle of 45 degrees with the light guide.
The fluorescent signals show different spectral widths and central wavelengths, the combination of which then results in the color impression of the respective color. In some cases, »shoulders« or »plateaus« appear to the left or right of the main maxima. These are presumably artifacts caused by the different spectral sensitivity of the sensor, which was not corrected before the images were taken. We will show how such a correction can be carried out in a later application example.
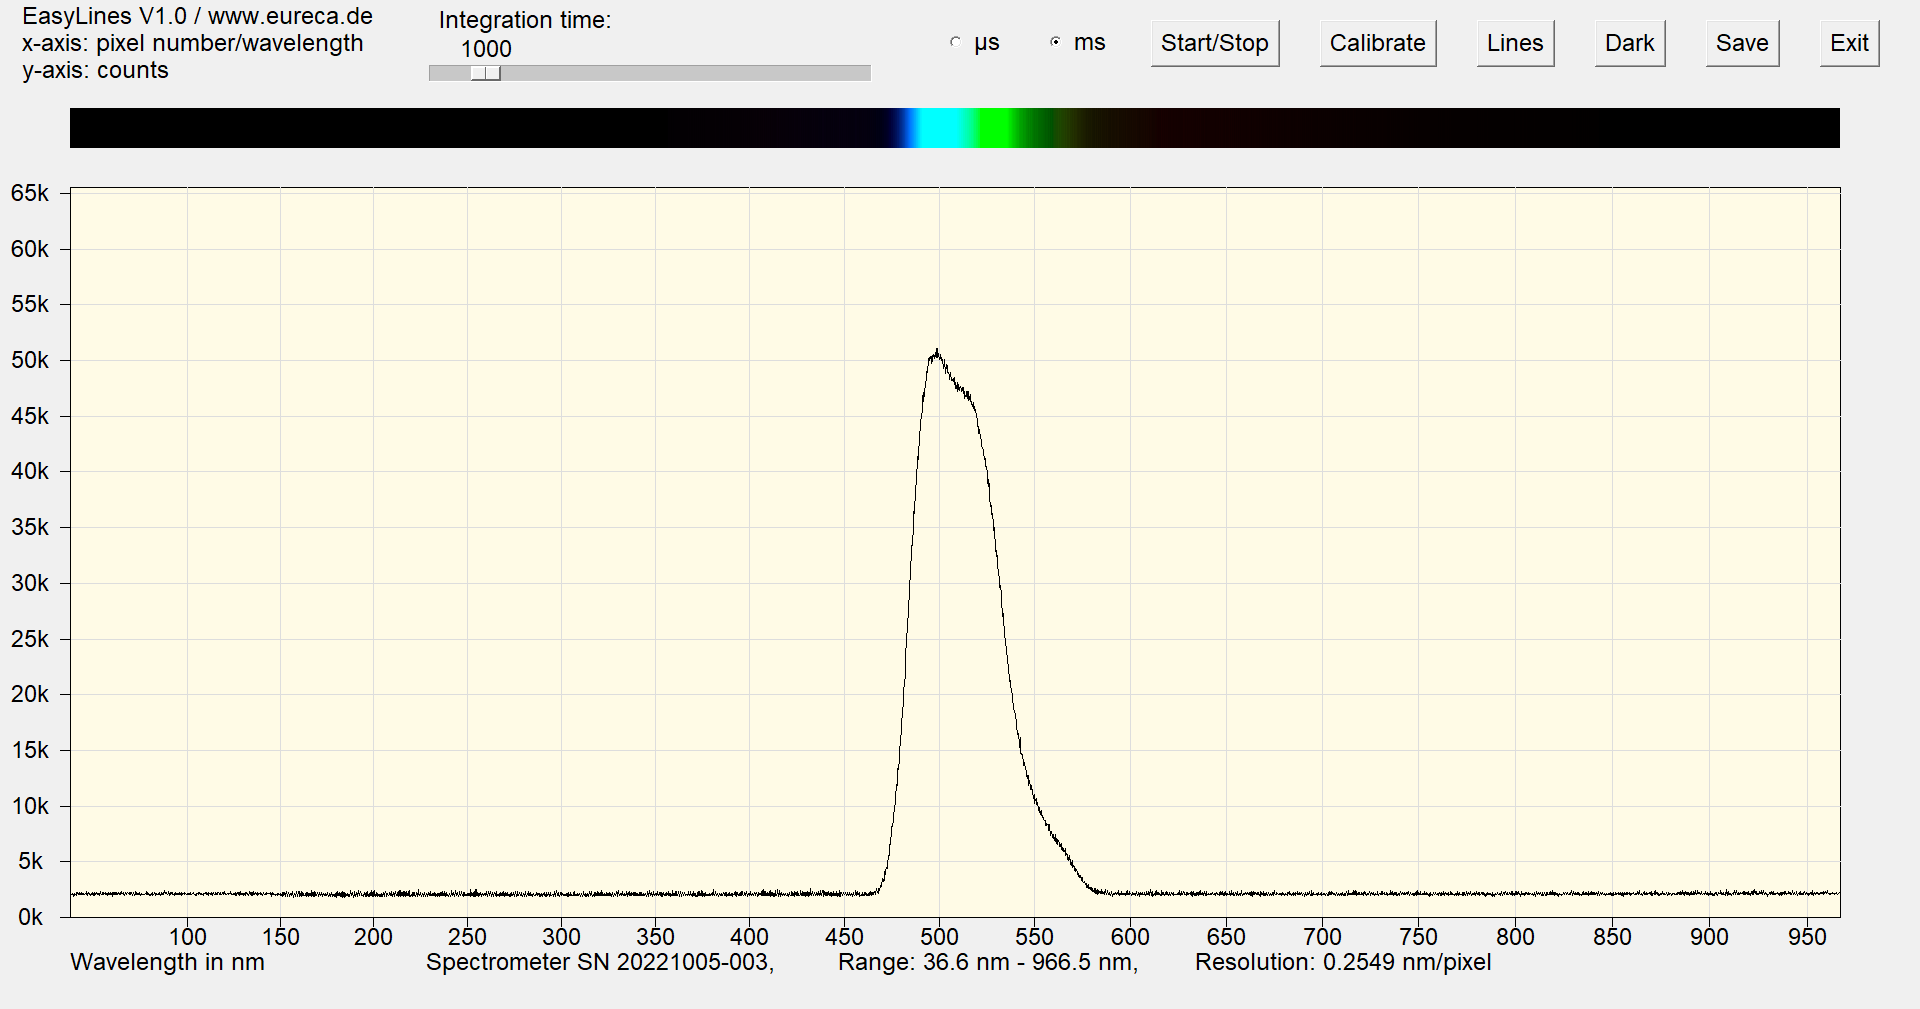
Spectrum of neon green; half-width of the signal approx. 50 nm; central wavelength at approx. 510 nm
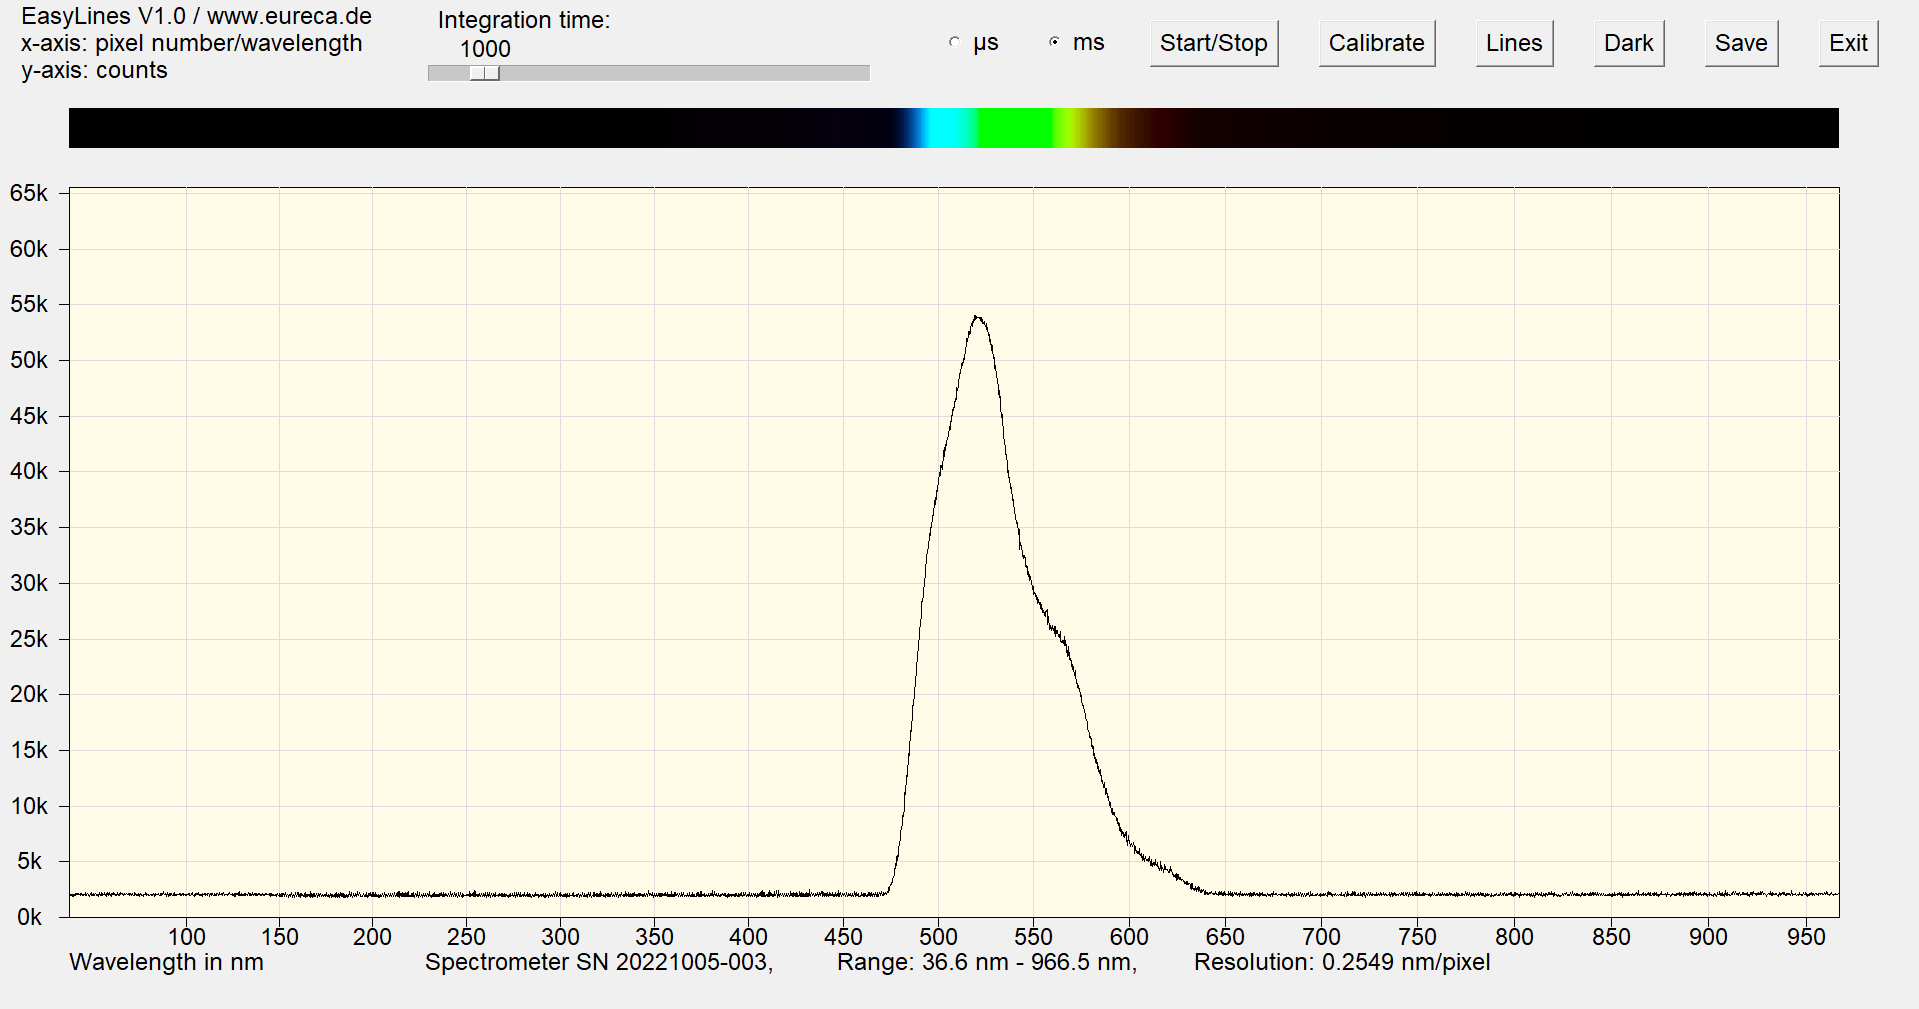
Spectrum of neon yellow; half-width of the signal approx. 75 nm; central wavelength at approx. 540 nm
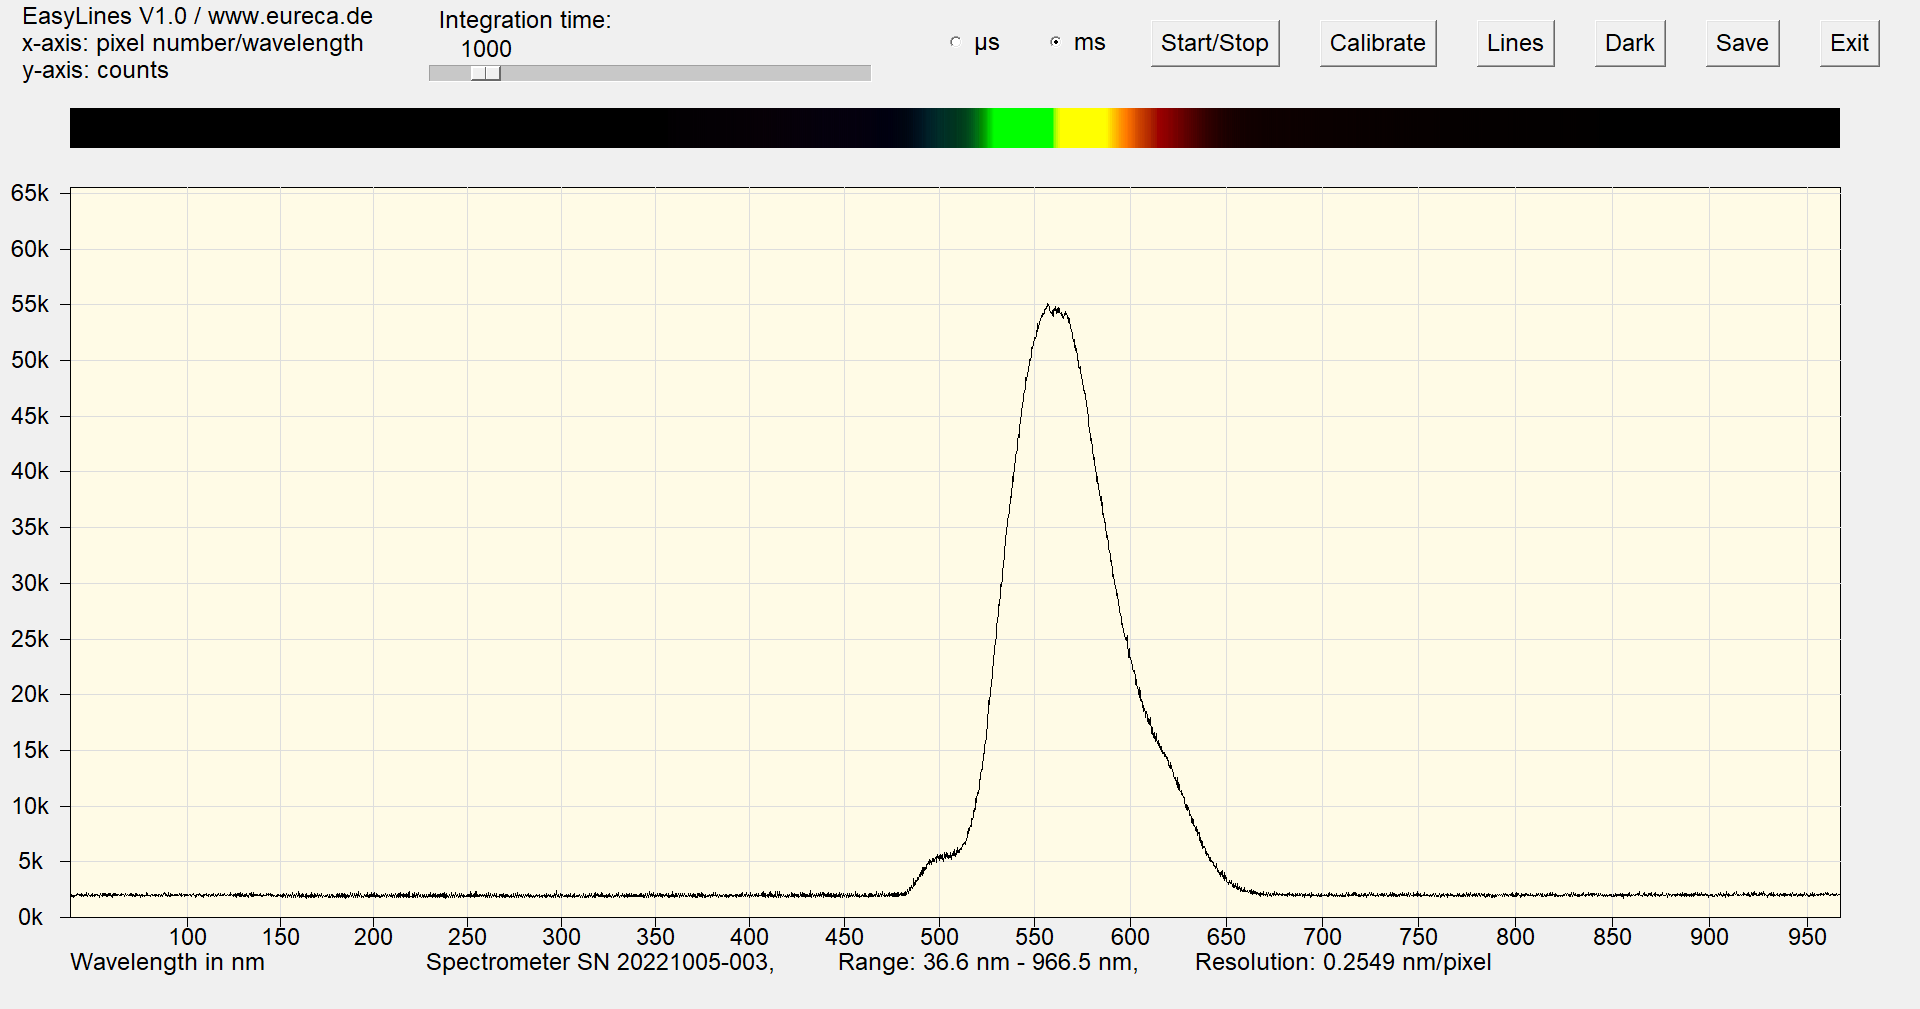
Spectrum of neon tangerine; half-width of the signal approx. 60 nm; central wavelength at approx. 560 nm
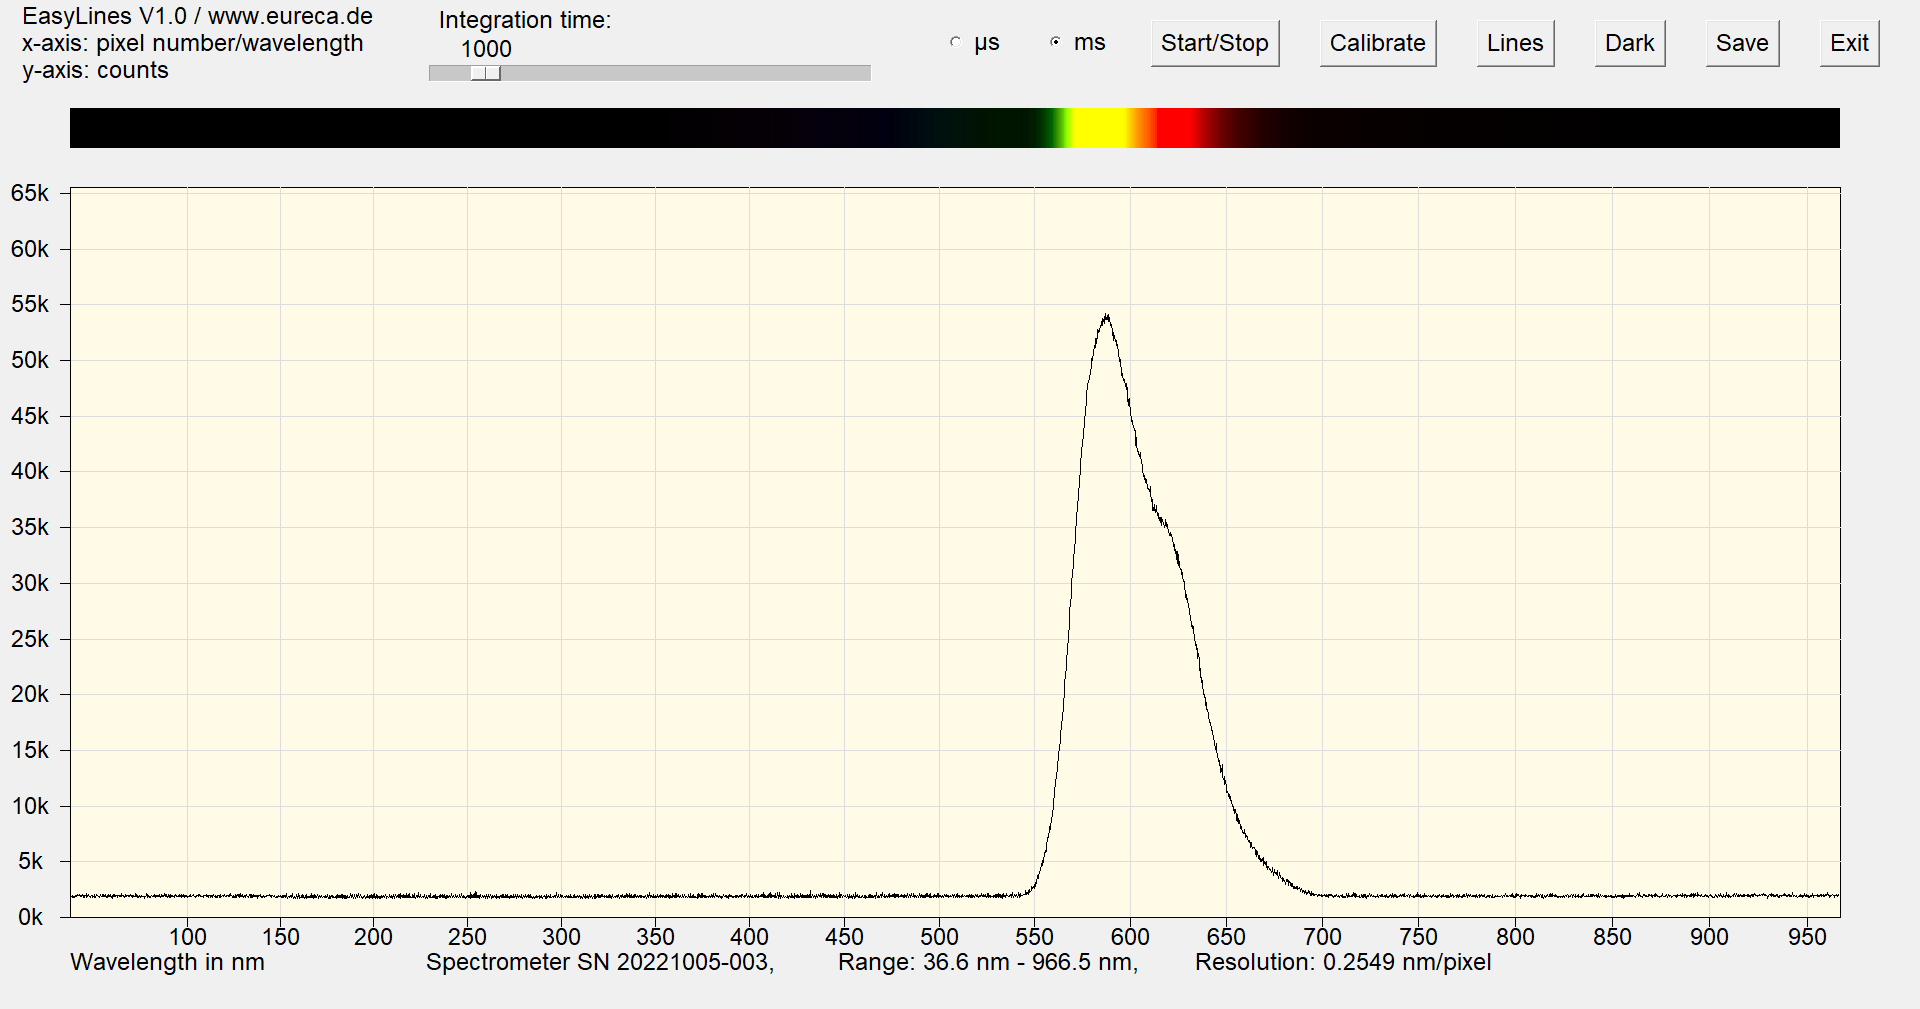
Spectrum of neon orange; half-width of the signal approx. 70 nm; central wavelength at approx. 605 nm
Note the longer integration time in this spectrum compared to the previous spectra; this color therefore shines less brightly with the same excitation.
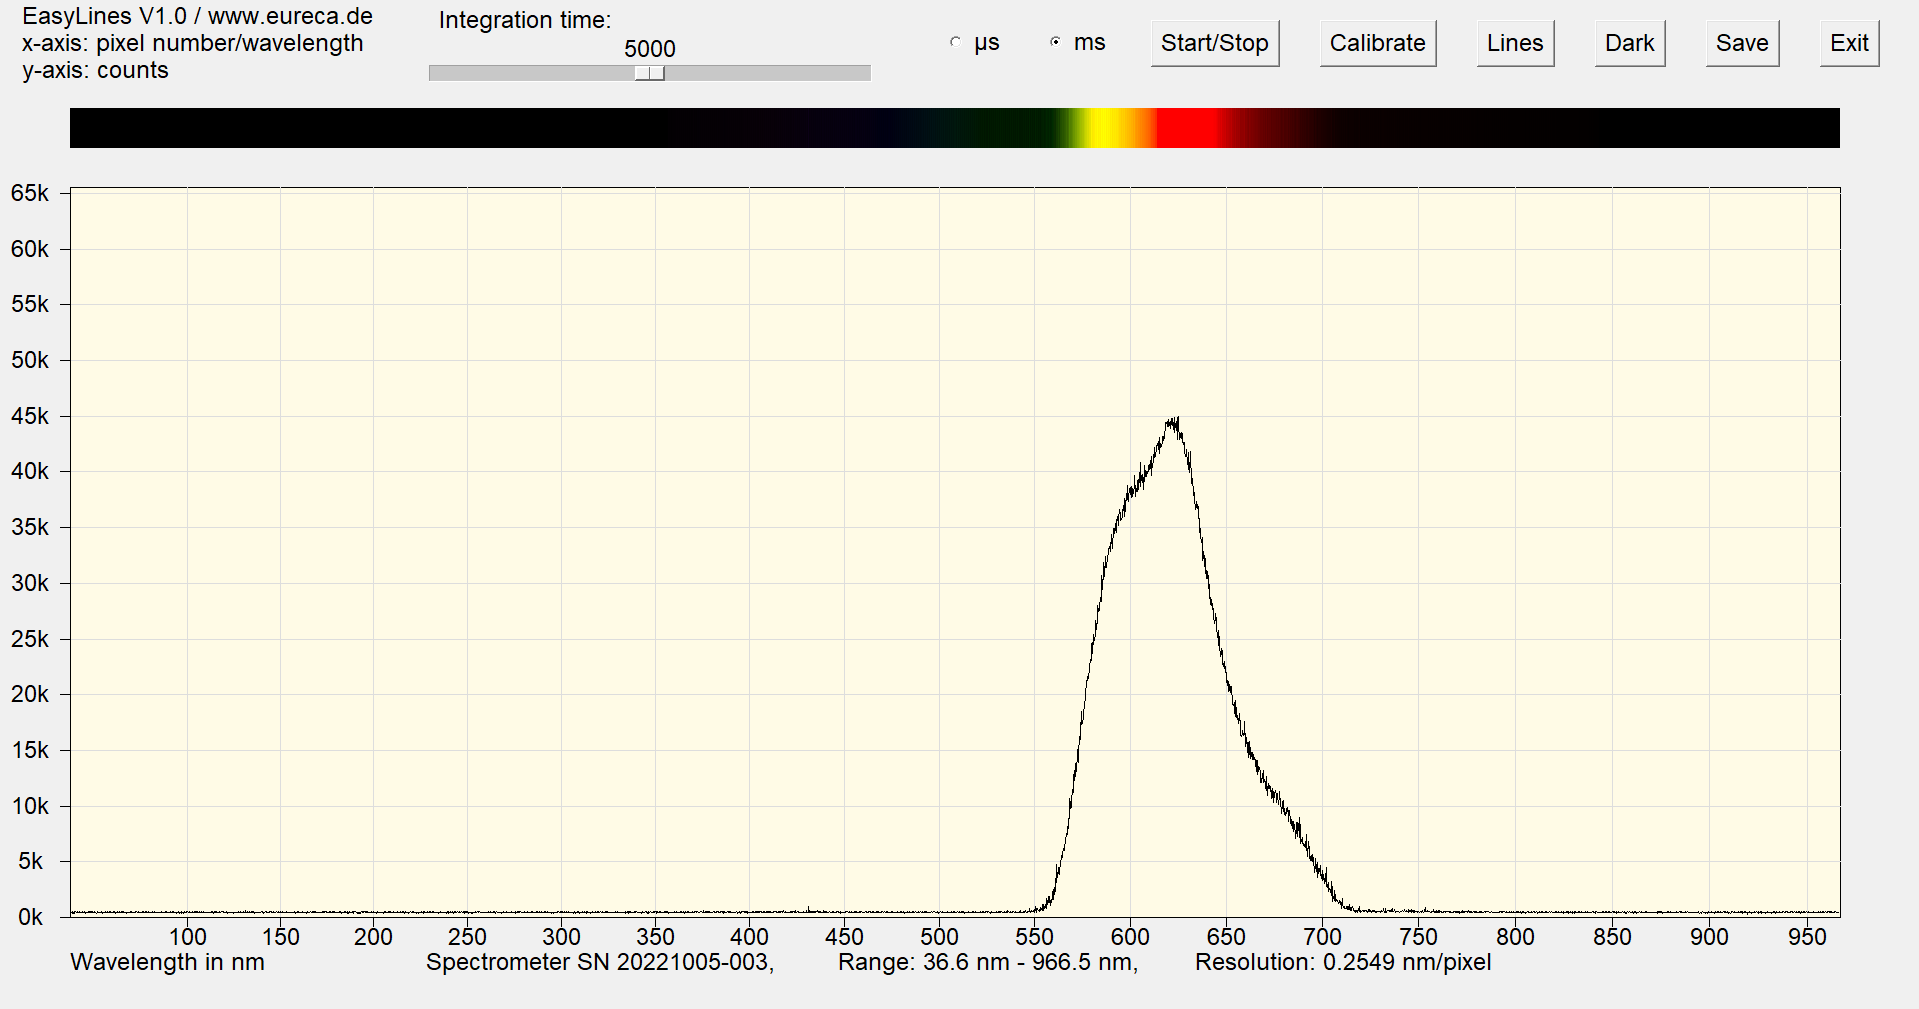
Spectrum of neon pink; half-width of the signal approx. 75 nm; central wavelength at approx. 620 nm
Note again the longer integration time compared to the first spectra; this color also shines less brightly with the same excitation.
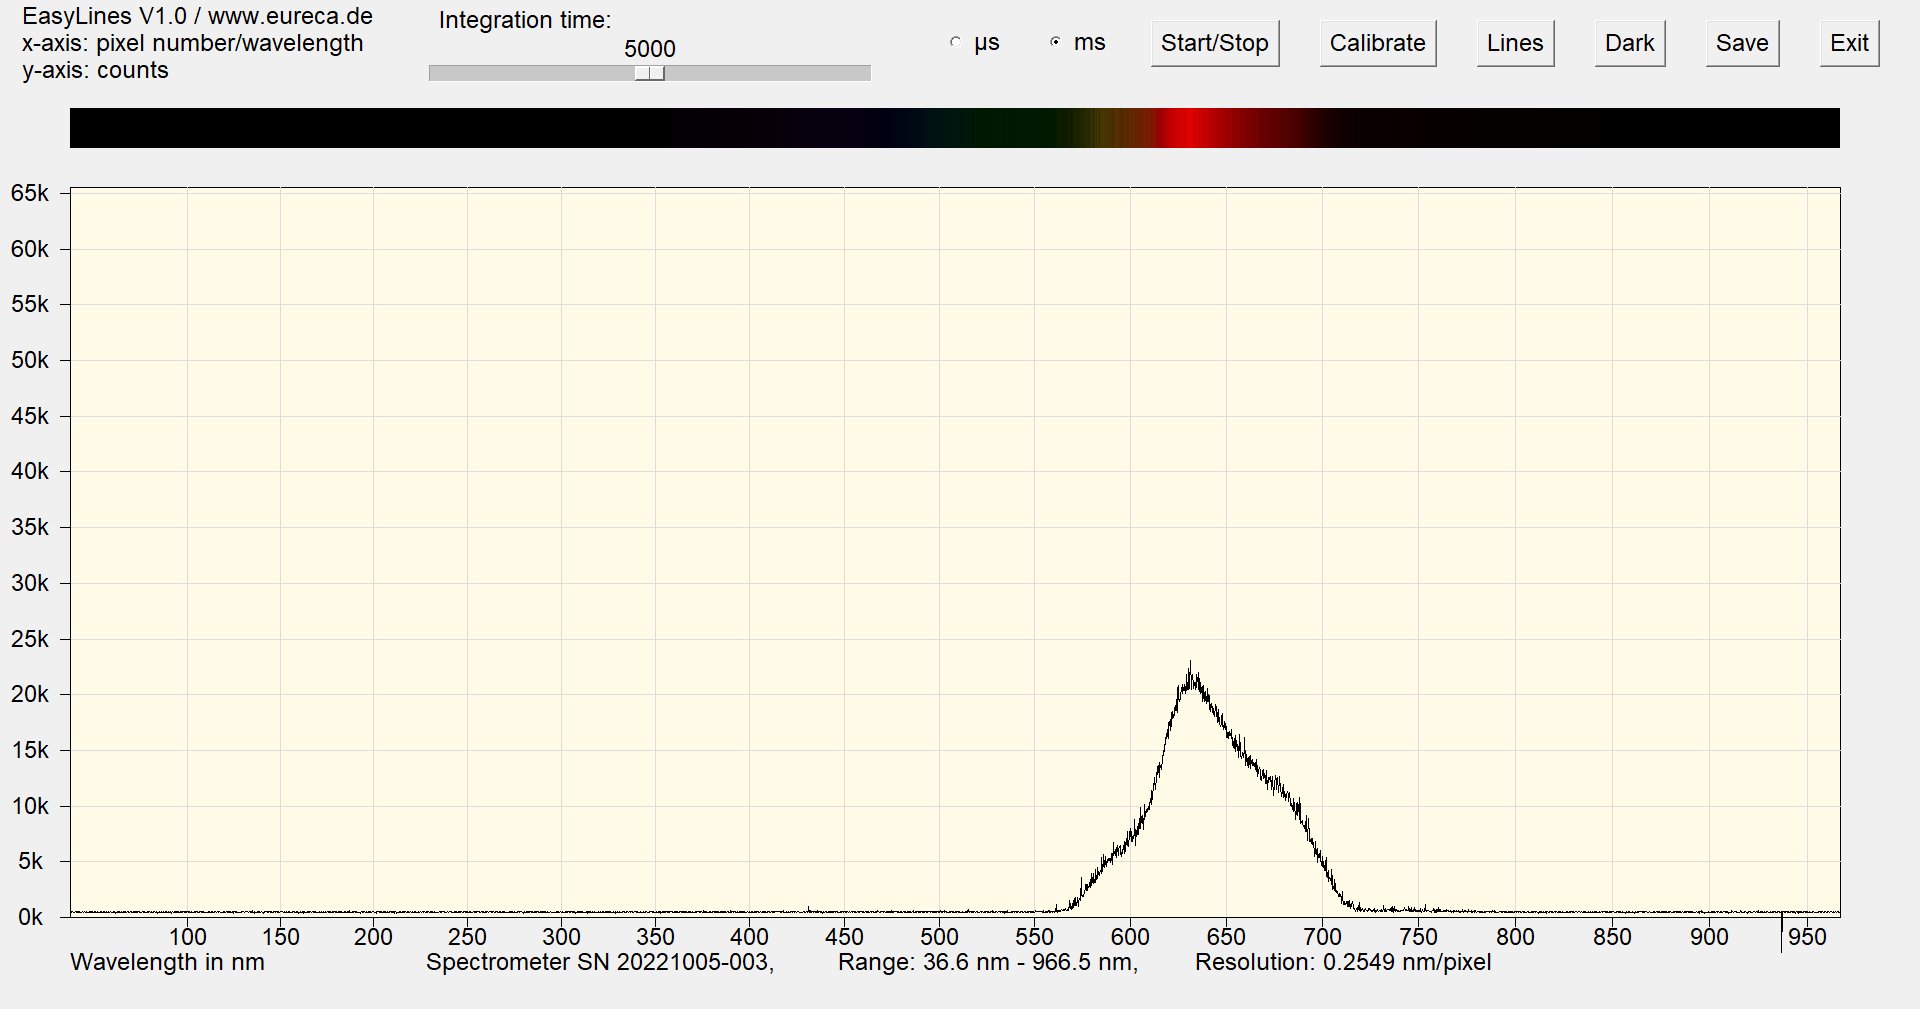
Spectrum of neon purple; half-width of the signal approx. 80 nm; central wavelength at approx. 645 nm
 Would you like to replicate the experiment—in your laboratory or teaching environment? Feel free to contact us—we will assist you with planning, setup, calibration, and selecting the right components. Eureca offers advice based on many years of expertise in optoelectronics, optics and spectroscopy—from DIY setups to OEM solutions. Feedback is expressly welcome: Please share your experiences, results, or suggestions for improvement with us.
Here you can easily ask a question or inquiry about our products:
Last update: 2025-10-31

EURECA Messtechnik GmbH
Deutz-Kalker Straße 35, D-50679 Köln
![]()
![]() Phone: +49 (0)221 952629-0
Phone: +49 (0)221 952629-0
Fax: +49 (0)221 952629-9
info(at)eureca.de
www.eureca.de


