

 MENU
MENU
HID lamps are a fascinating source for spectroscopic investigations. You press »On« … and in the first few seconds, an HID lamp does not simply switch to an »On/Off« state, but rather undergoes a dynamic warm-up process.
The light is produced according to a formula that only fully unfolds at operating temperature: first, the starting gas dominates, then the mercury arc takes over – and only when the burner gets really hot do the added metals come into play and visibly shape the spectrum.
You can't see much of this with the naked eye. But with the spectrometer, you get a real insight into the list of ingredients: as it warms up, the lamp shows step by step which atoms are currently playing the leading role.
To examine this more closely, we recorded three spectra with our DIY spectrometer:
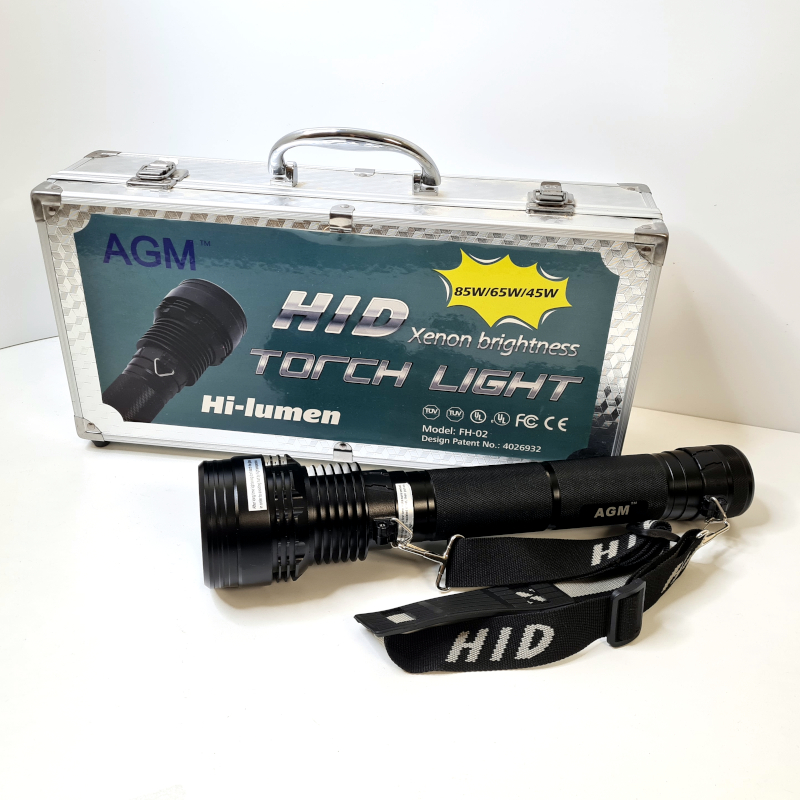
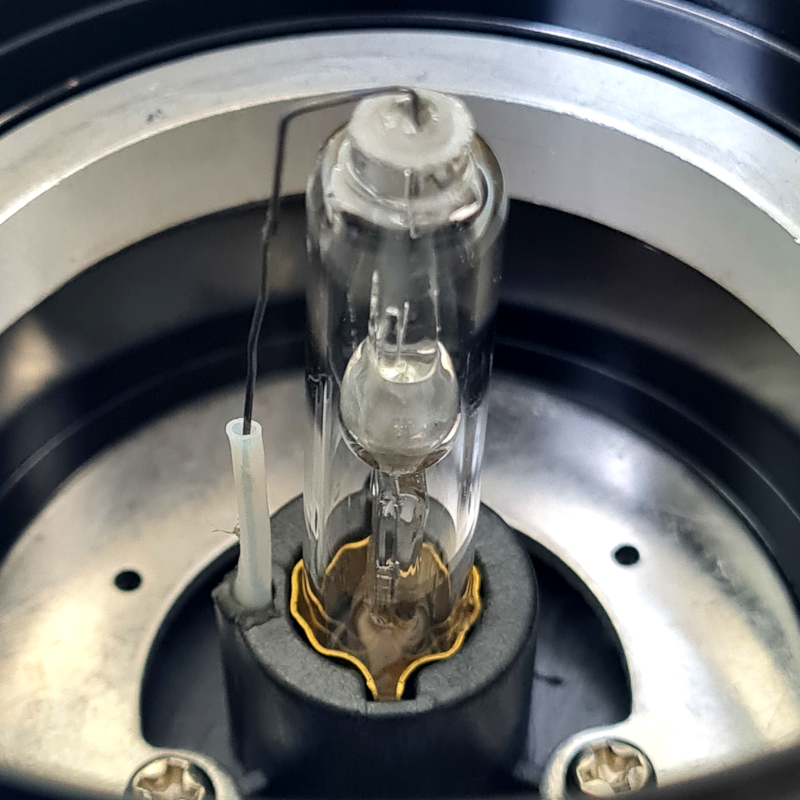
HID stands for High Intensity Discharge: instead of a filament or LED, there is an electric arc in a small burner (»arc tube«). To ignite it, a starting gas is initially inserted (in flashlight HIDs, this is often xenon, sometimes argon mixtures). In many HID designs, mercury (Hg) is added to make the arc stable and very bright.
And then comes what makes HID lamps so »special«: metal halides (metal salts, e. g., NaI, TlI, ScI₃ …). These are initially cold and solid somewhere in the burner. Only when everything is hot enough do they evaporate and partially disintegrate into atoms/ions in the plasma. This creates additional spectral lines. The result: the spectrum changes dramatically as it warms up.
The spectra were recorded using one of our DIY spectrometers.

A simple Python script was used as software to set the integration time and line overlay (»Lines«); this makes the peak detection process significantly easier.
The light from the HID lamp was fed into the spectrometer via a TosLink/POF optical fiber; extremely practical: robust and inexpensive. The end of the light guide was placed approximately 2 m away from the flashlight.
Safety note when setting up: HID light is extremely bright, the burner gets hot, and some types can emit a lot of UV radiation. Do not look directly into it, keep your distance, let it cool down!!!
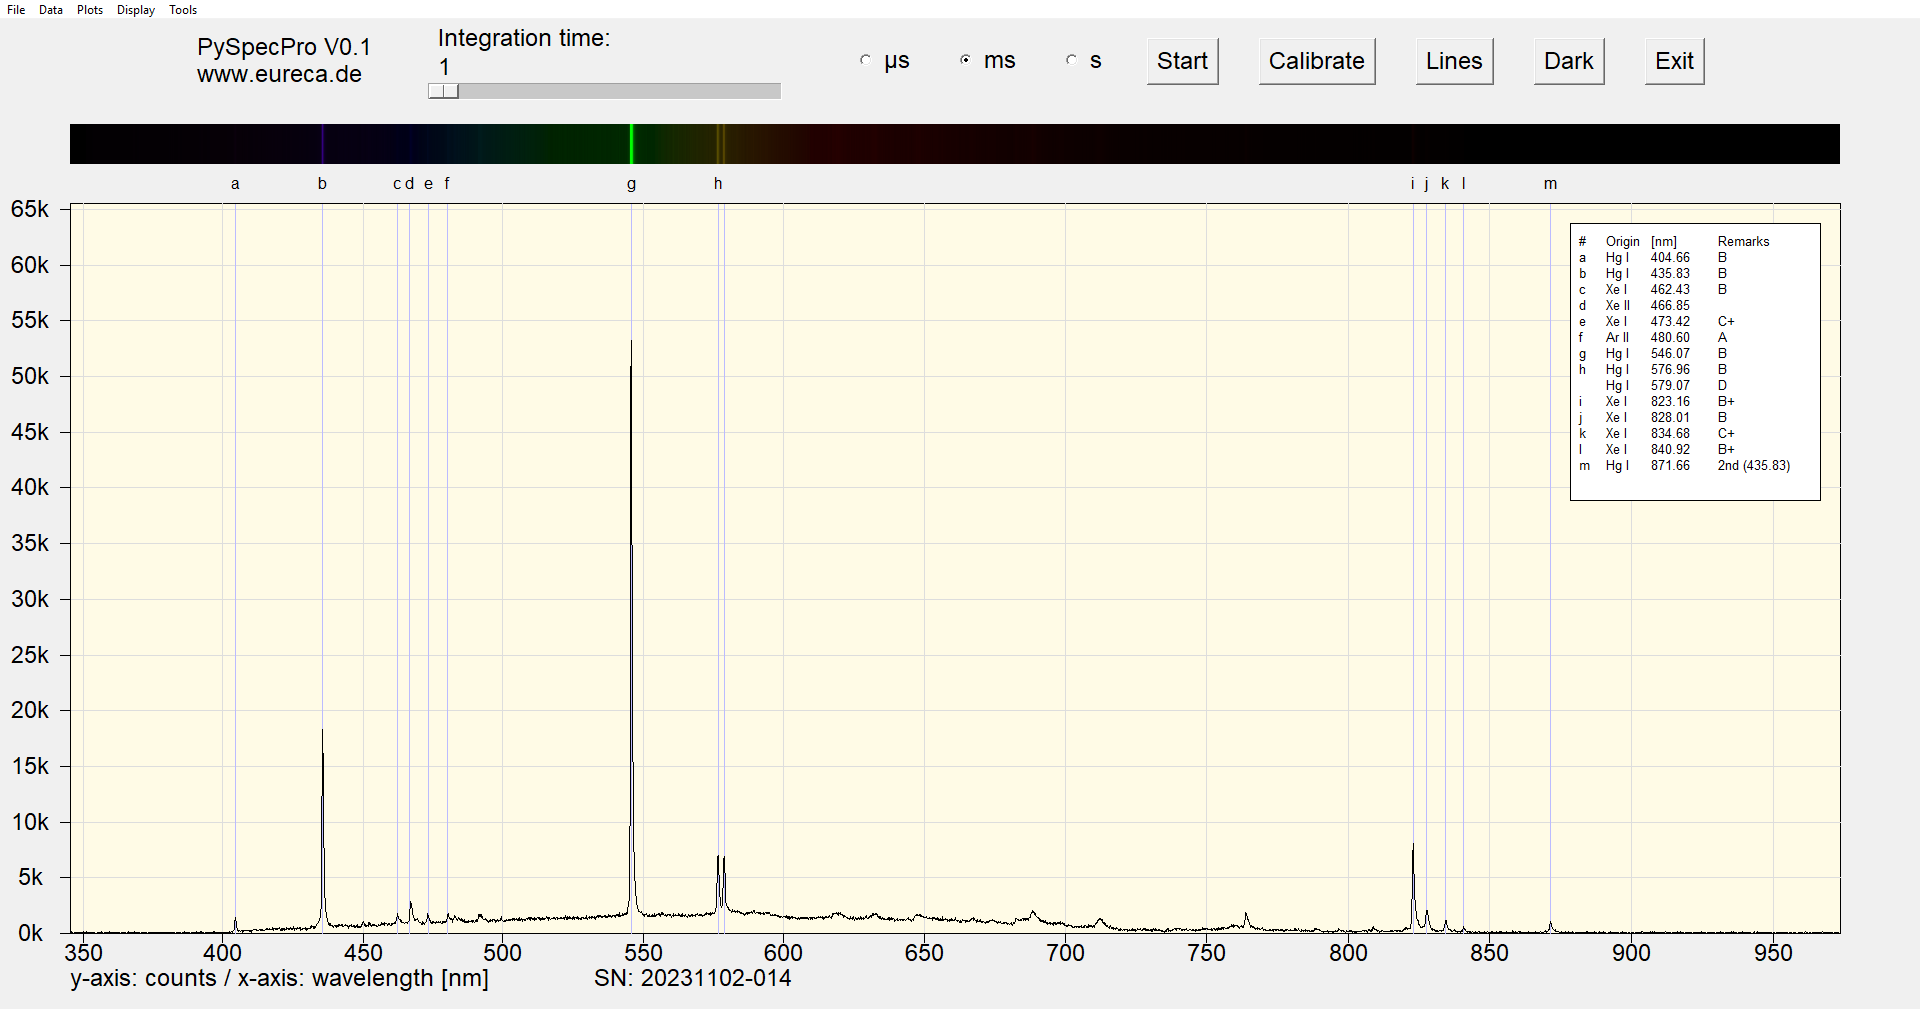
When cold, the first emission lines to be found are those that can be attributed to xenon. There is even a peak marked as Xe II (ionized xenon) – which is consistent with the start-up phase: ignition/start-up means high field strengths, »hard« discharge, and the gas is the star at first.
Hg lines then appear early on: mercury is the reliable emitter in many HID systems, acting as the »workhorse«. In the first few seconds, the lamp »lives« visually mainly from the starting gas + Hg. Metal halides are hardly in the vapor at this point.
The line that appears at 871.66 nm is the second order of the Hg line at 435.83 nm. This »ghost line« (m=2) is a perfect textbook demonstration of why spectrometers need order sorting filters for some applications.
After about 10 seconds, the picture changes: xenon largely disappears from the main role. Hg continues to dominate, but now new strong players appear:
This is exactly the typical HID warm-up behavior: as the temperature rises, the salts evaporate, become »active« in the plasma – and as a result, the spectrum takes on new, strong lines.
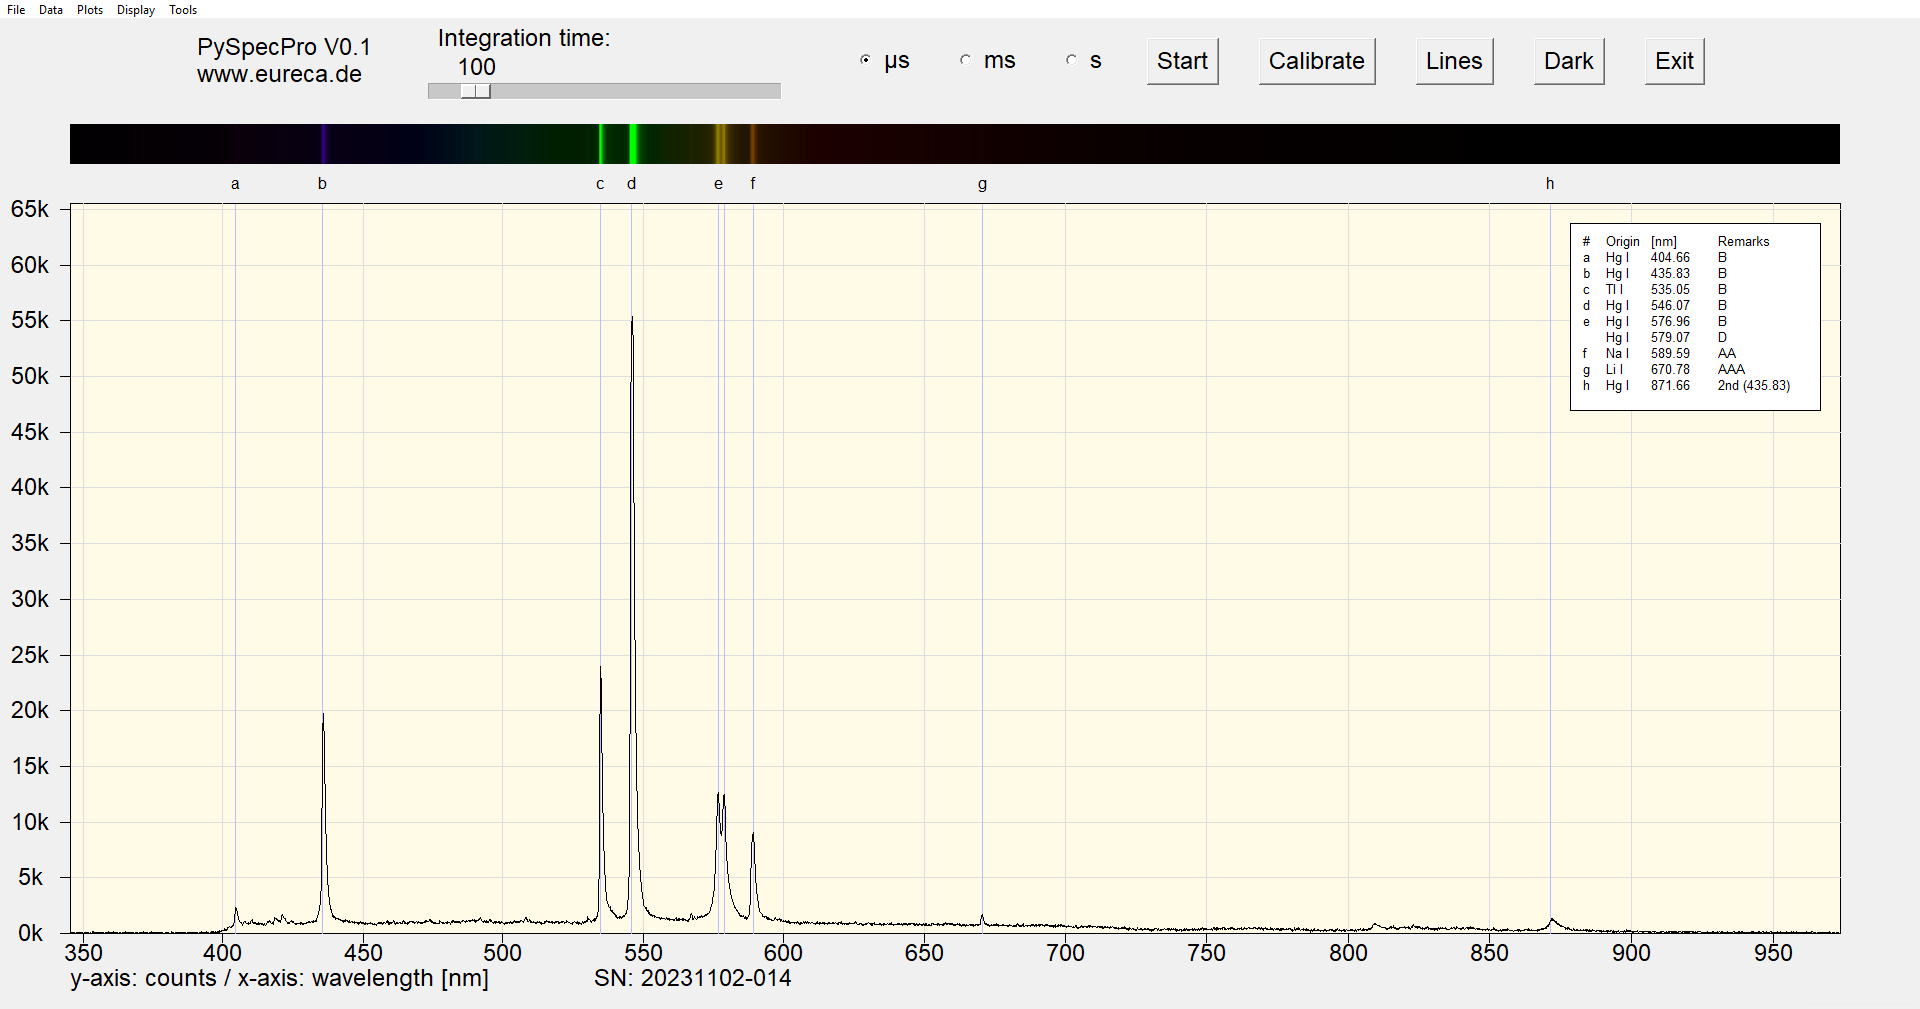
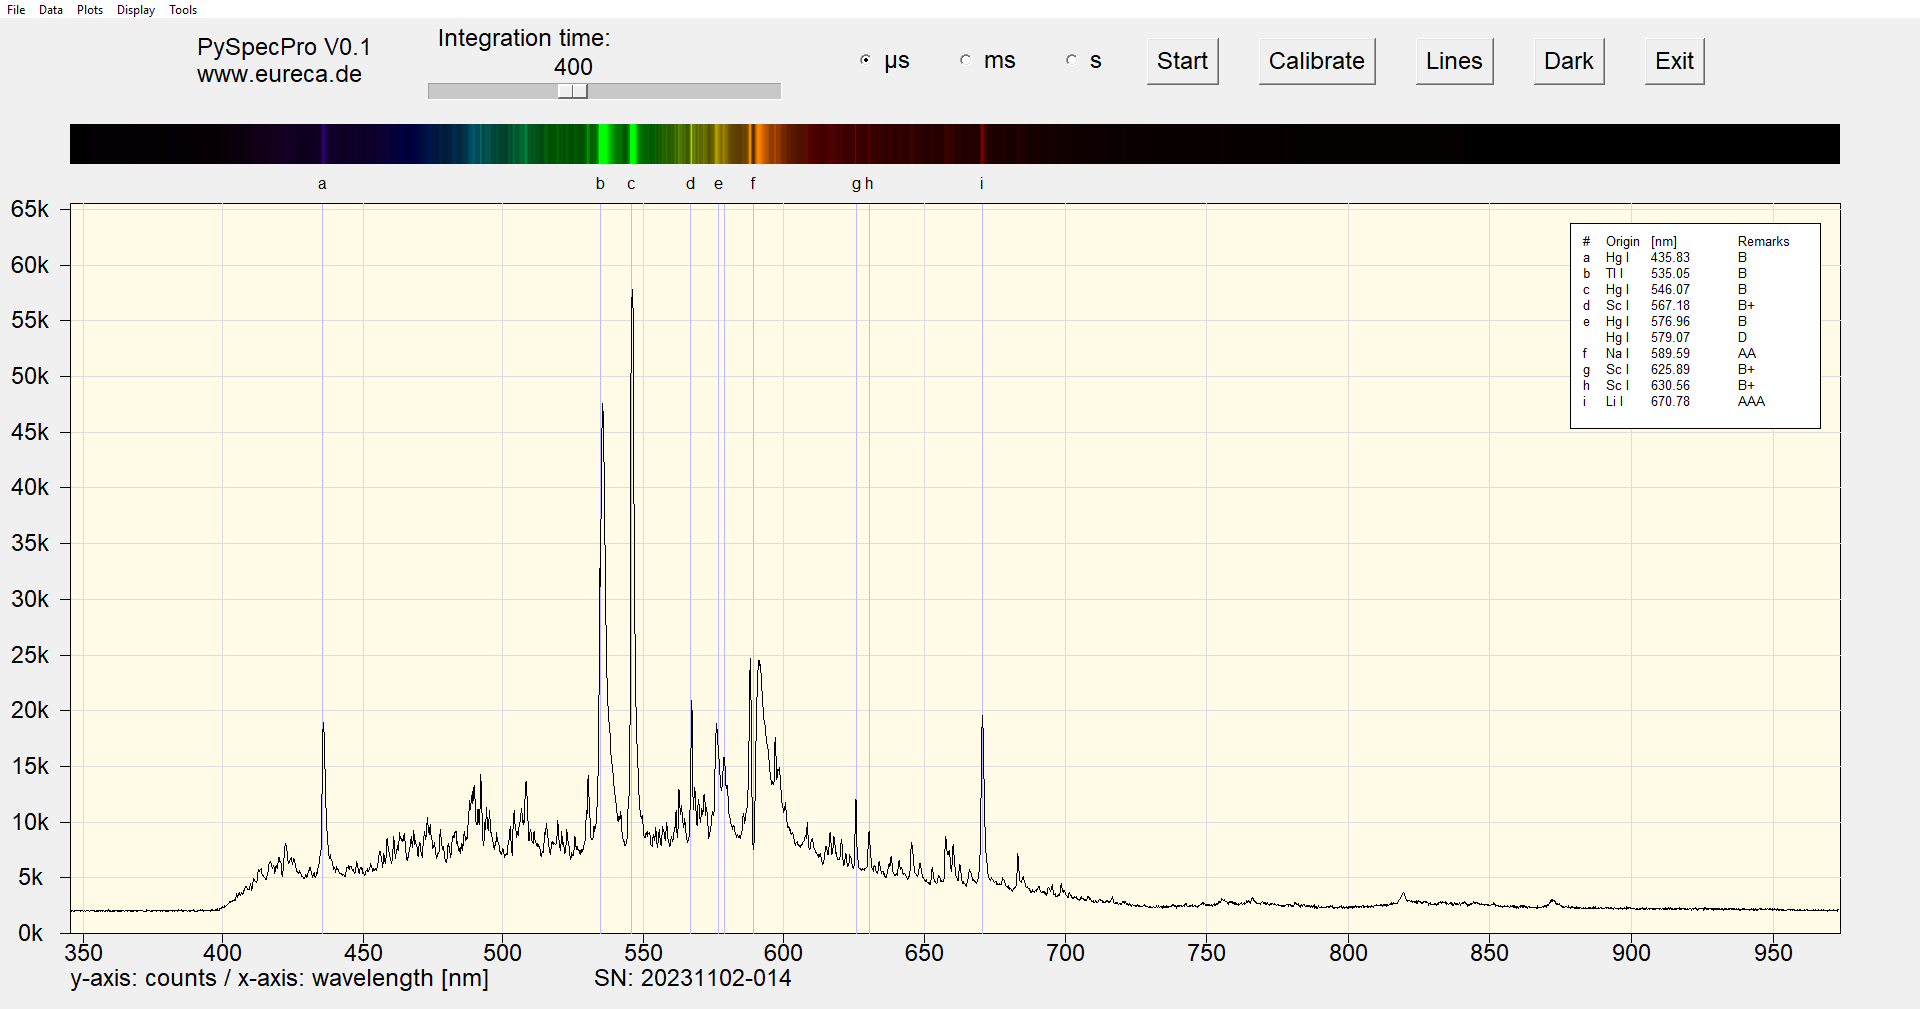
When stable and hot, you can see very clearly:
Hg remains visible as the basic structure (e. g., 435.8 / 546.1 / 577.0 / 579.1 nm).
Tl remains very present (535.05 nm) – an »efficiency boost« in the green.
Na is very prominent (589.59 nm) – this range then also appears broad/structured in the hot state because pressure and self-absorption effects come into play under HID conditions.
In addition, further lines now appear that indicate lithium and scandium as ingredients. Li + Sc + Na + Tl is a very typical »metal halide spice mixture« for shaping the spectrum and color rendering of HID lamps.
The following video shows the temporal development of the spectrum during the start-up and warm-up phase of the HID lamp:

The burner of an HID is small – but during operation, very high temperatures and pressures prevail. It is more like a »mini plasma reactor« than a »light bulb«.
The famous yellow sodium line at 589 nm (more precisely: the Na-D double at 589.0 nm and 589.6 nm) is so dominant here in its hot state that it not only shines brightly, but also gets in its own way, so to speak, in the lamp plasma. Then something happens that looks like a scratch or dip in the middle of the peak in the spectrum: self-absorption (also called self-reversal).
The explanation is simple: in the hot center of the arc, sodium atoms are strongly excited and emit the D lines very intensely and broadened due to the high pressure. But the burner is not a homogeneously hot »point«; it has temperature and density gradients: around the outside, there are cooler zones with many sodium atoms in their ground state. And it is precisely these atoms that preferentially absorb the exact same wavelength emitted by the hot zones – especially in the case of resonance lines such as the Na-D lines.
 Would you like to replicate the experiment—in your laboratory or teaching environment? Feel free to contact us—we will assist you with planning, setup, calibration, and selecting the right components. Eureca offers advice based on many years of expertise in optoelectronics, optics and spectroscopy—from DIY setups to OEM solutions. Feedback is expressly welcome: Please share your experiences, results, or suggestions for improvement with us.
Here you can easily ask a question or inquiry about our products:
Last update: 2026-01-15

EURECA Messtechnik GmbH
Deutz-Kalker Straße 35, D-50679 Köln
![]()
![]() Phone: +49 (0)221 952629-0
Phone: +49 (0)221 952629-0
Fax: +49 (0)221 952629-9
info(at)eureca.de
www.eureca.de


