

 MENU
MENU
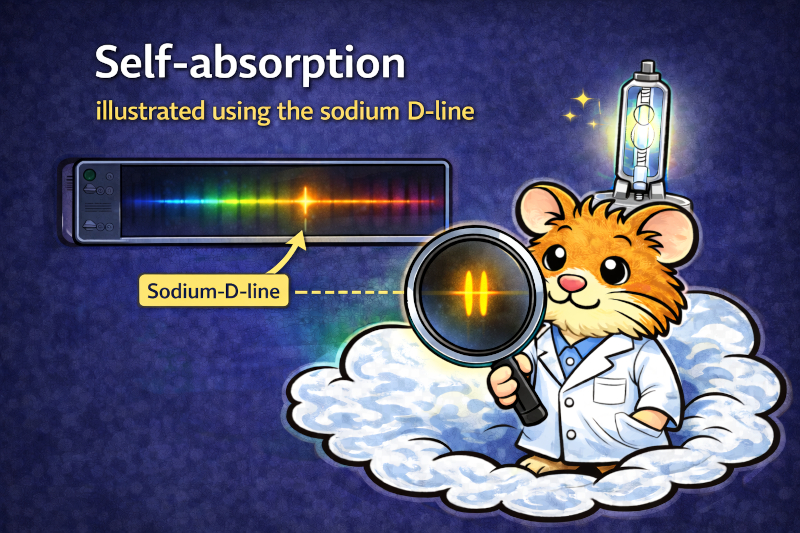
In this application example, we use one of our DIY spectrometers to show time-resolved self-absorption and self-reversal using the famous sodium D lines in an HID lamp as an example.
By using a grating with 1200 lp/mm, the two lines can be clearly separated. The temporal course during heating of the lamp then shows how the lines first appear separately in the spectrum, then merge and grow into a broad peak, which eventually begins to show »dips« in the middle.
HID (high-intensity discharge) lamps are spectroscopically real showstoppers: in just a few seconds, a delicate starting glow develops into an extremely bright plasma – and the spectrum changes dramatically in the process. Metal halide HID systems typically contain a starting gas and (often) mercury, as well as metal halides such as sodium, scandium, and, in some chemistries, thallium – it is precisely this mixture that later shapes the visible spectrum.
We have already discussed the temporal development of the spectrum of an HID lamp across the visible range in a separate application example.
When you think of sodium in the spectrum, you almost automatically think of the Na-D lines: a very distinctive yellow double peak. Physically, these are two closely spaced transitions of neutral sodium (Na I):
Because these lines are extremely »strong« (high transition probability) and also originate from/enter the ground state, they appear in many plasma physics and astronomical contexts – and also in HID lamps.
When an HID lamp is operating at high temperatures, the burner core is a very dense, hot plasma. It is precisely these conditions that cause spectral lines to become wider rather than remaining »ideally thin«:
Now comes the twist that explains the phenomenon of self-absorption in HID lamps:
The burner is not equally hot everywhere. Typically:
The light from the hot core must pass through this cooler edge area on its way out. And that is exactly where the »perfect absorbers« for Na-D are located: sodium atoms in the ground state.
Important to note: Absorption is strongest at the line center. This means that photons at exactly 588.995 nm and 589.592 nm are preferentially removed. The wavelengths slightly to the side (line wings) are absorbed much less strongly.
When this absorption becomes strong enough, something seemingly paradoxical happens: The emission peak is large and broad overall, but has superimposed relatively narrow dips or troughs at the wavelengths of the Na-D lines.
This is the classic self-reversal as a clearly visible special case of self-absorption: the burner emits a line – and partially absorbs it again itself at the edge.
(The »absorbed« radiation has often not simply disappeared, but is re-emitted in other directions and sometimes slightly shifted due to resonance processes. However, to the spectrometer along a line of sight, it appears as if less radiation is arriving at the line center.)
The key idea that later makes self-absorption immediately plausible is simple:
The following video shows the spectrum in the range between 510 nm and 650 nm during the ignition phase and warm-up of the HID lamp. A DIY spectrometer with the following specifications was used for this purpose:
The resolution of the spectrometer is sufficiently high due to the use of the 1200 lp/mm grating to clearly separate the D-double line – when using gratings with fewer lines per millimeter, this usually merges into a single line.
Observation (simplified into phases):
In the original application example for the HID lamp , the question was raised as a stimulus for further research as to whether the HID lamp used really contains scandium. With the help of the high-resolution spectrum used here, the answer to this question can now be given:
When hot, additional lines can be found in the spectrum that can be attributed to scandium (Sc I / Sc II). This fits very well with common metal halide chemistries (Na-Sc systems are classic) and is therefore a strong indication that the burner used in the HID lamp actually contains Sc.
Higher resolution (1200 lp/mm) therefore not only means »nicer lines«, but also enables significantly more robust element identification.

A brief clarification on spectroscopy notation:
The fact that xenon is in the lamp at all fits in with many HID concepts: a noble gas serves as a starting/buffer gas so that the lamp is conductive during warm-up and provides light before the metal halides have completely evaporated. Xenon is often used for this purpose (depending on the lamp type and application).
When hot, additional peaks appear whose wavelengths are consistent with known Xe II transitions. This suggests that the xenon component in the plasma is partially ionized (Xe⁺).
 Would you like to replicate the experiment—in your laboratory or teaching environment? Feel free to contact us—we will assist you with planning, setup, calibration, and selecting the right components. Eureca offers advice based on many years of expertise in optoelectronics, optics and spectroscopy—from DIY setups to OEM solutions. Feedback is expressly welcome: Please share your experiences, results, or suggestions for improvement with us.
Here you can easily ask a question or inquiry about our products:
Last update: 2026-02-17

EURECA Messtechnik GmbH
Deutz-Kalker Straße 35, D-50679 Köln
![]()
![]() Phone: +49 (0)221 952629-0
Phone: +49 (0)221 952629-0
Fax: +49 (0)221 952629-9
info(at)eureca.de
www.eureca.de


