MENU
MENU
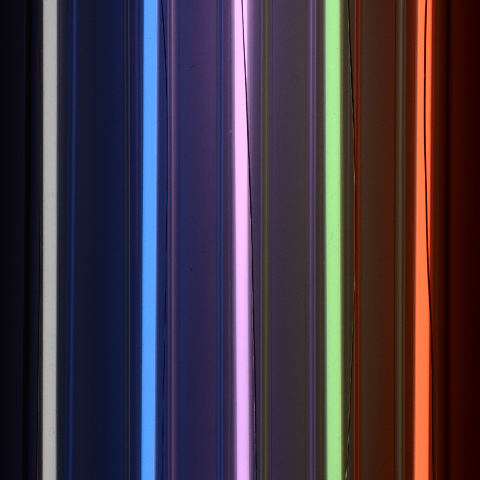
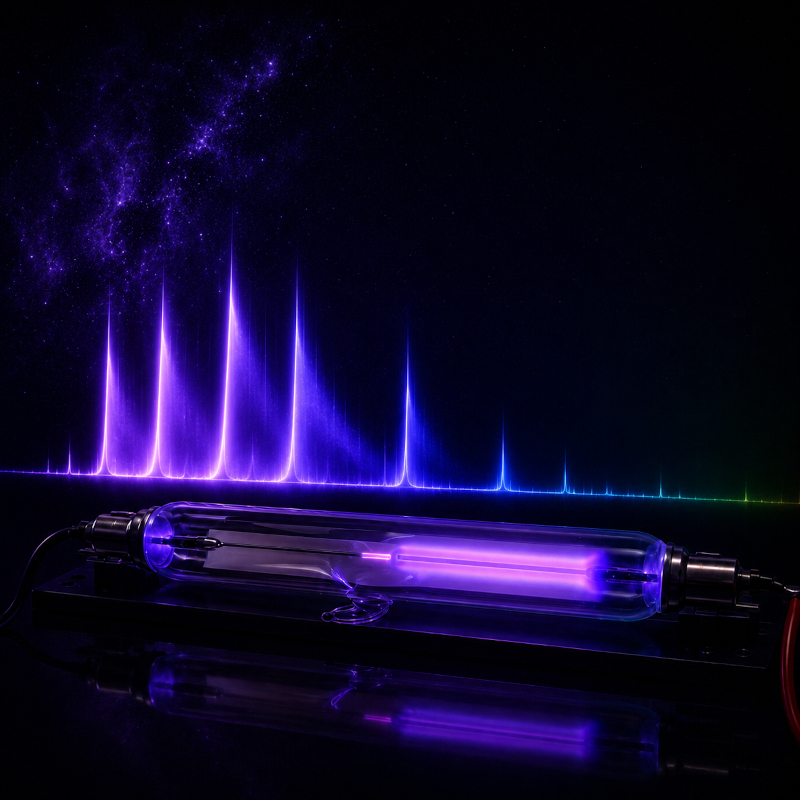
To demonstrate the range of possible applications, we show here a collection of spectra recorded with our DIY spectrometers or our micro spectrometer.
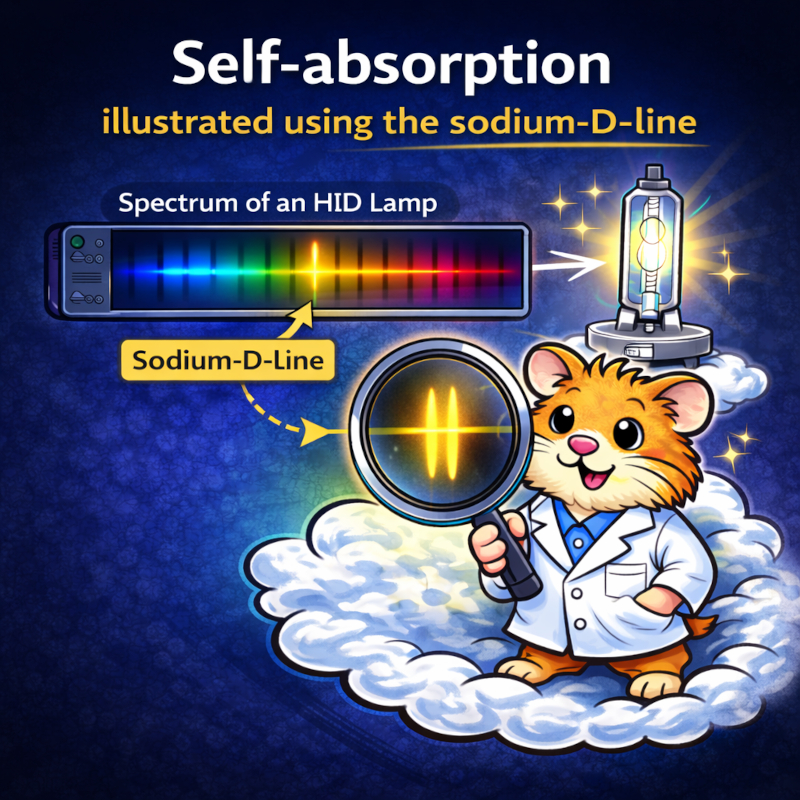
Most of the spectra were recorded using our EasyLines Python script. In addition to displaying the recorded spectrum, this also allows the positions of emission lines whose data are read in from an external file to be displayed (source: Internet database NIST (Atomic Spectra Database | NIST)). ¹
Such light sources are particularly interesting for spectroscopic measurements in the fields of physics, electrical engineering, chemistry and materials science.
These sources are based on electrical discharges in gases, whereby atoms and molecules are excited and emit characteristic emission lines or band spectra.
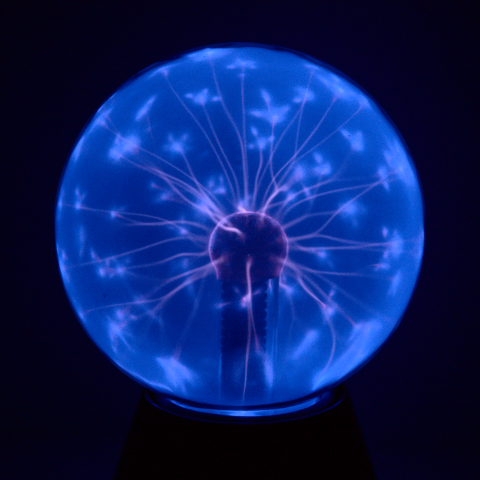
Examples of this are
On a subpage we have compiled examples of some of the spectra we have recorded from this category of light sources.
These sources for spectroscopic measurements are particularly suitable for the fields of physics, chemistry, materials science and, in some cases, biology.
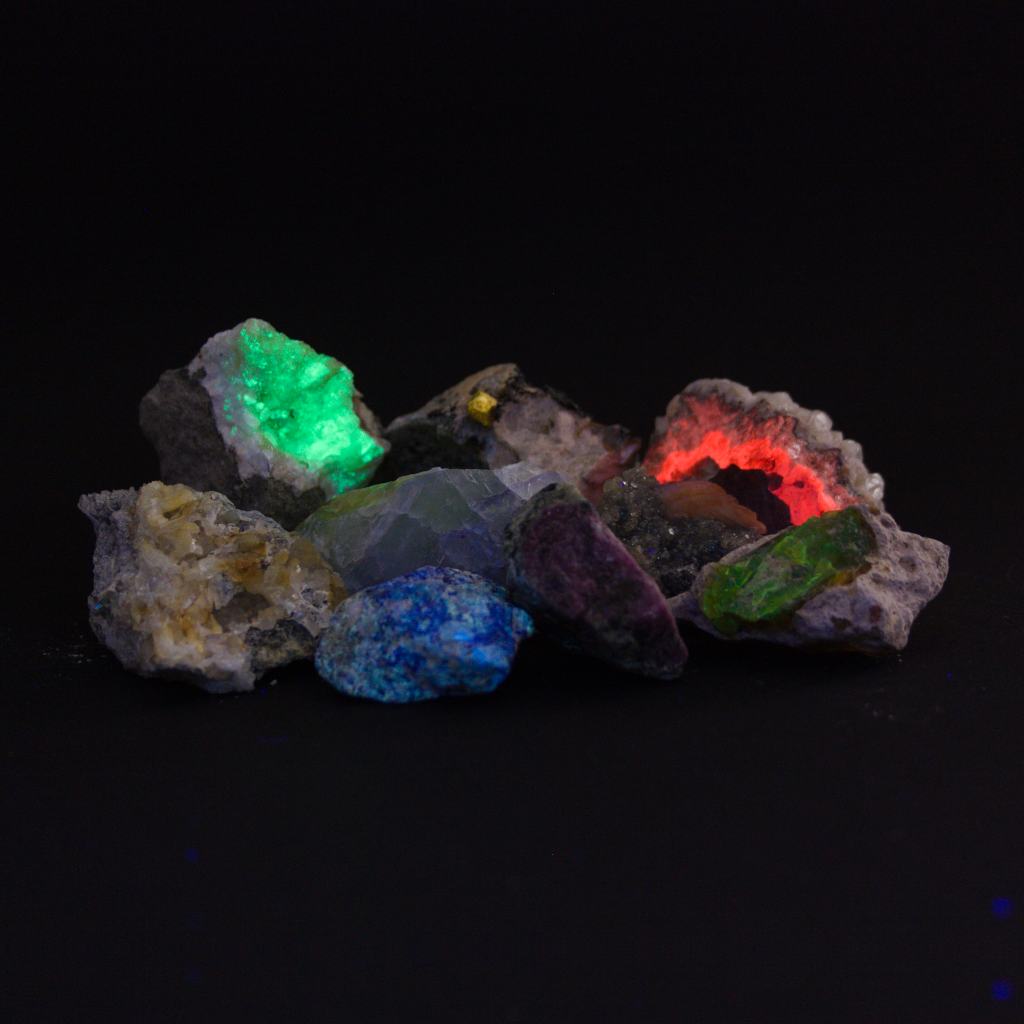
Here, light is generated by absorption of excitation light (often UV) and subsequent emission in the visible spectrum—a phenomenon that is intensively studied in biochemistry, materials research and analytical chemistry.
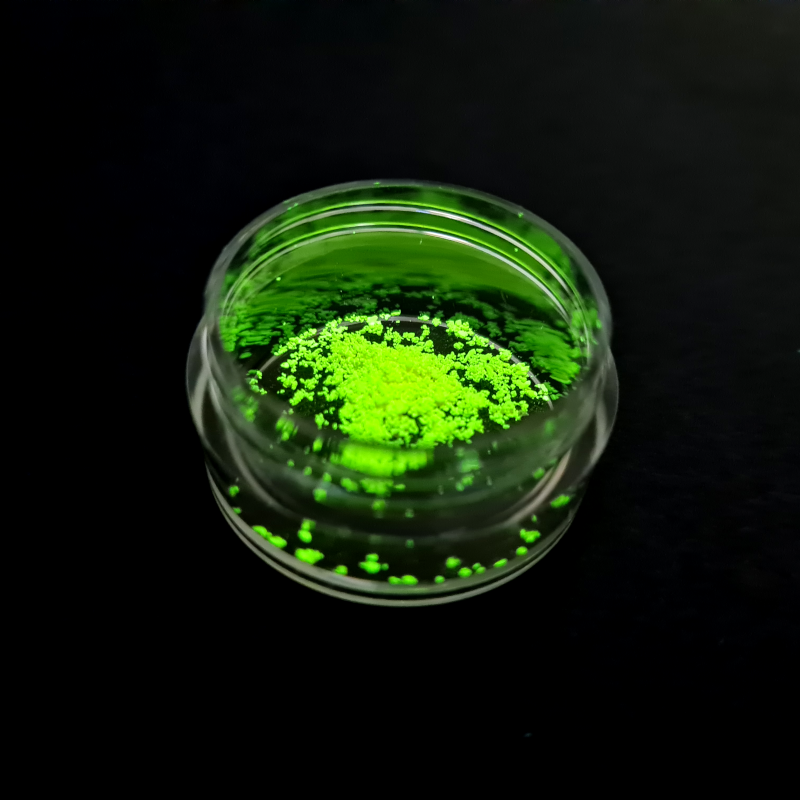
Examples of this are
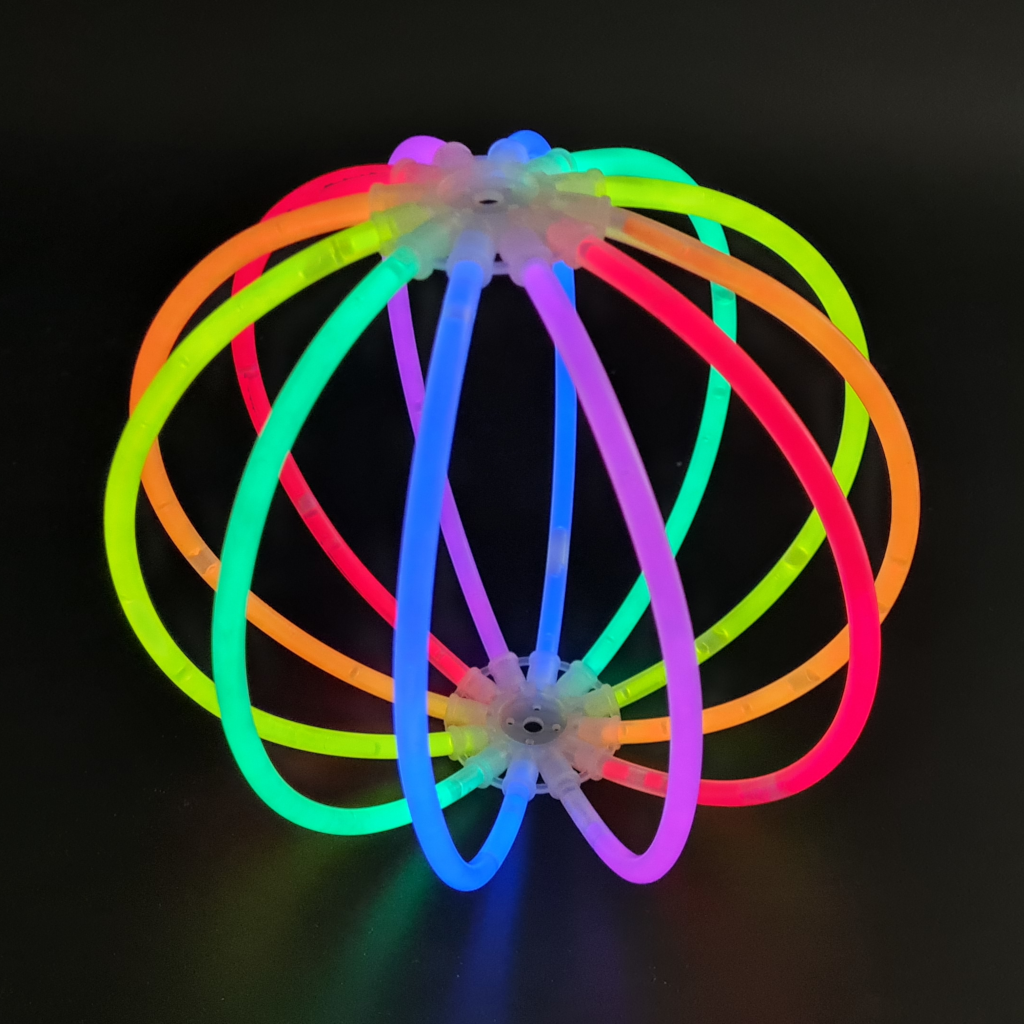
Spectroscopy experiments with the following chemiluminescence sources are aimed at the chemistry and physics departments. With these sources, light is released directly by chemical reactions without the need for an external light source.
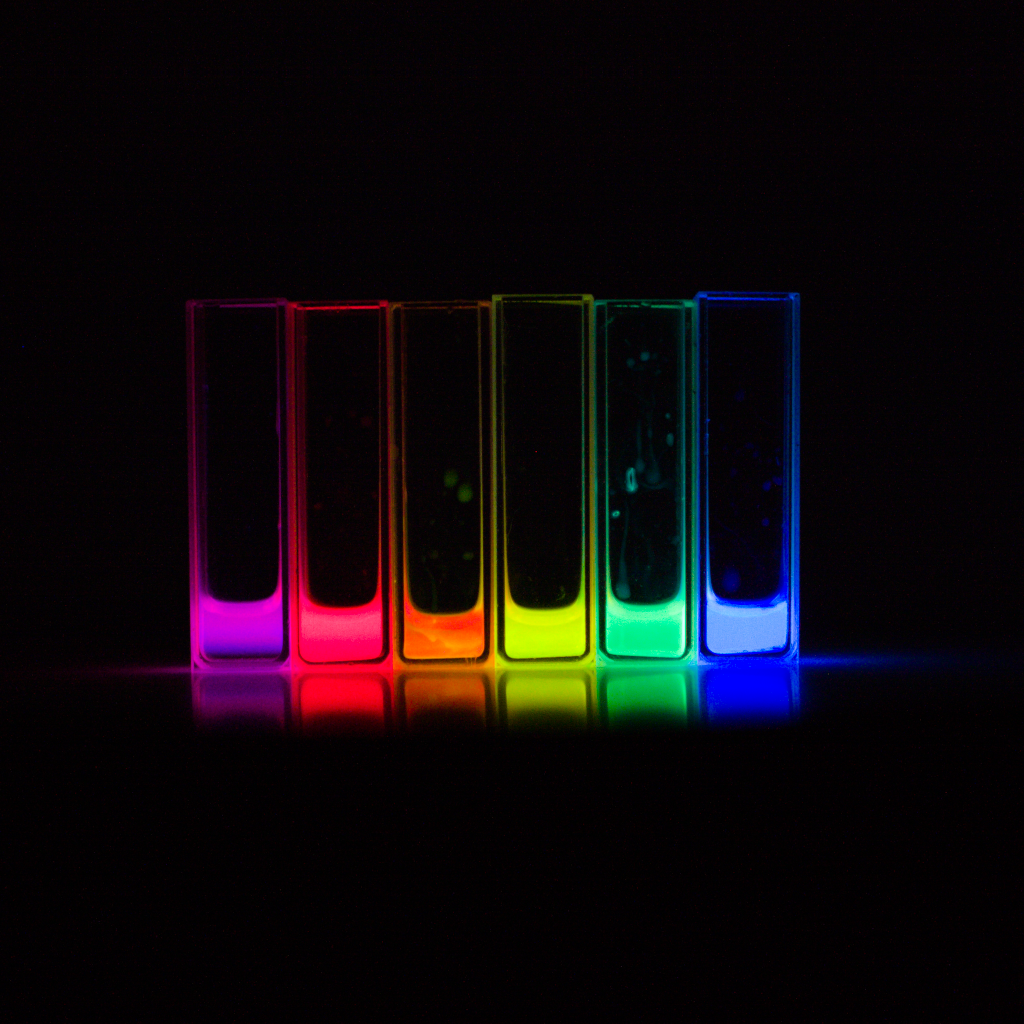
On a subpage we have compiled examples of some of the spectra we have recorded from this category of light sources.
Spectra from this area are of interest to the fields of physics, engineering and semiconductor physics. These light sources are based either on the heating of a material (incandescent light bulbs) or on recombination-induced light emission in semiconductors (LEDs). Examples of this are
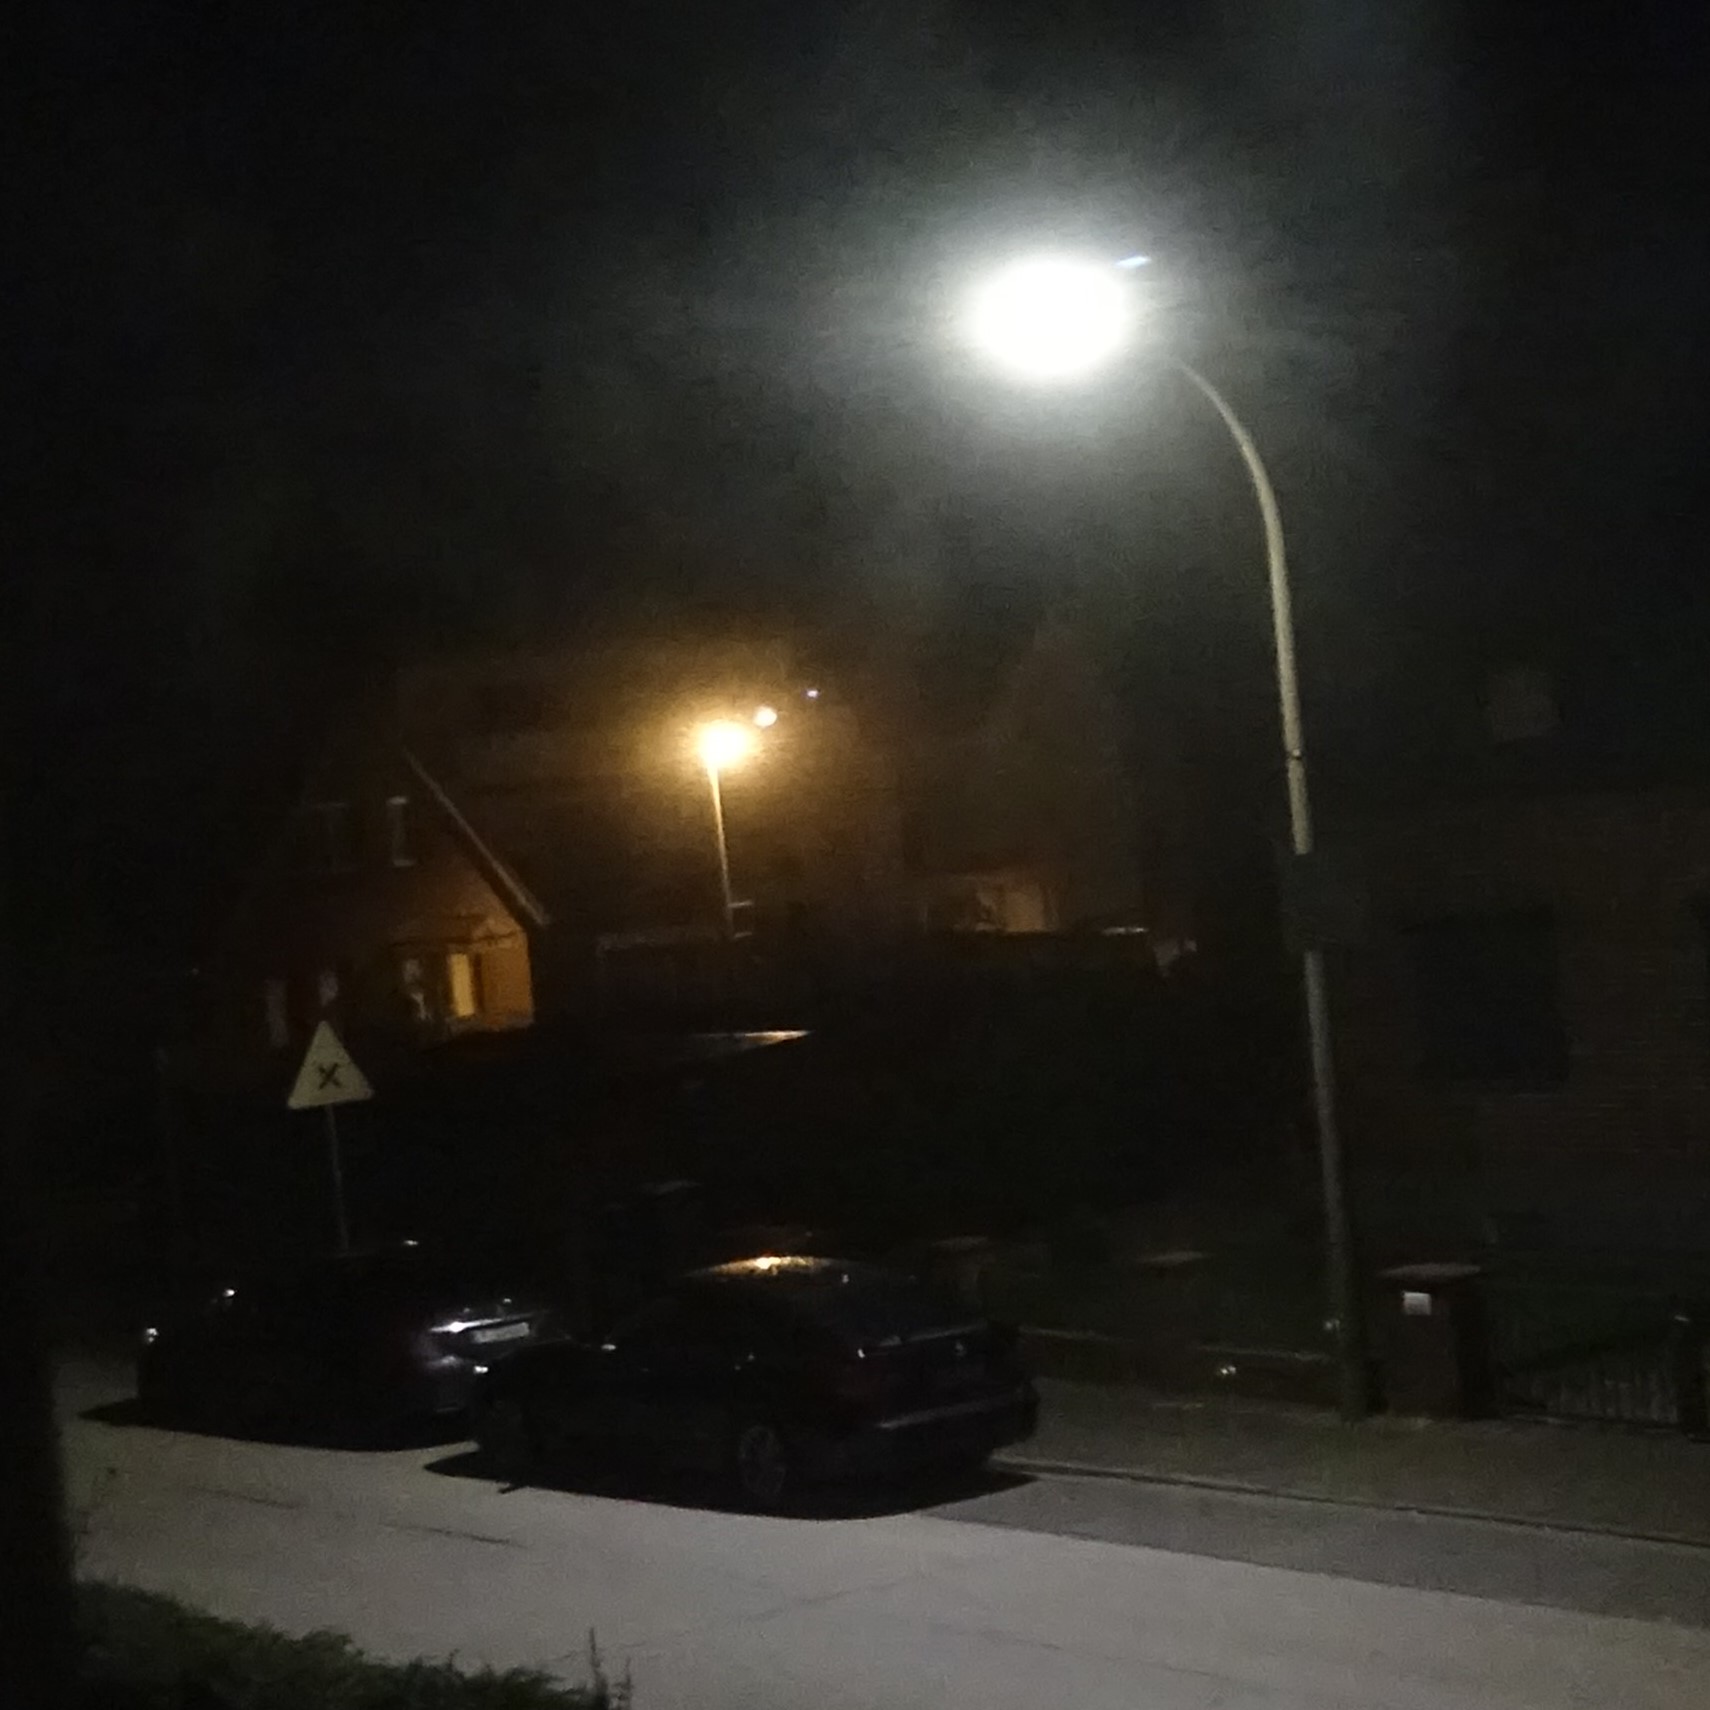
On a subpage we have compiled examples of some of the spectra we have recorded from this category of light sources.
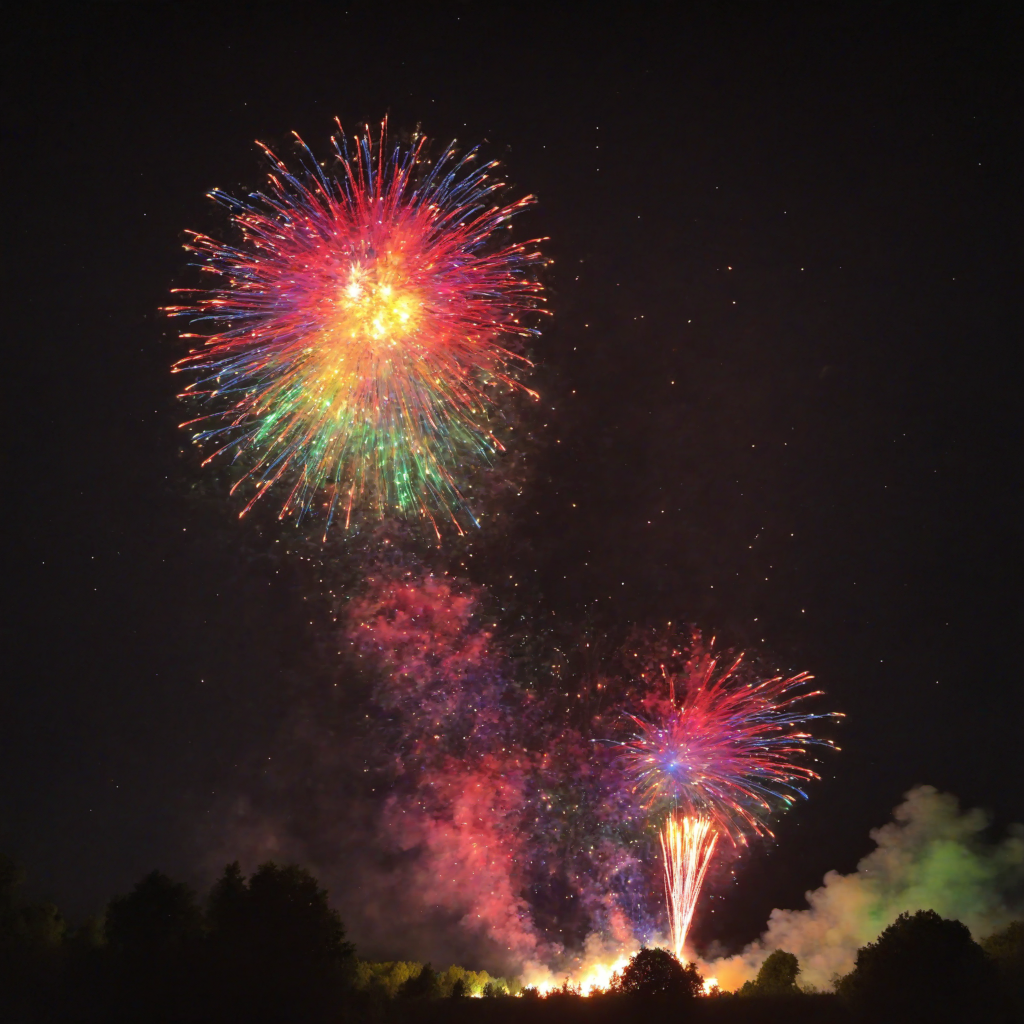
Measurements with the following sources will find particular appeal in the fields of astronomy, physics and atmospheric sciences. These measurements are concerned with natural spectra, such as those produced by atmospheric processes or in astrophysical objects—topics of central interest in astronomy and environmental physics.

Examples of this are
On a subpage we have compiled examples of some of the spectra we have recorded from this category of light sources.
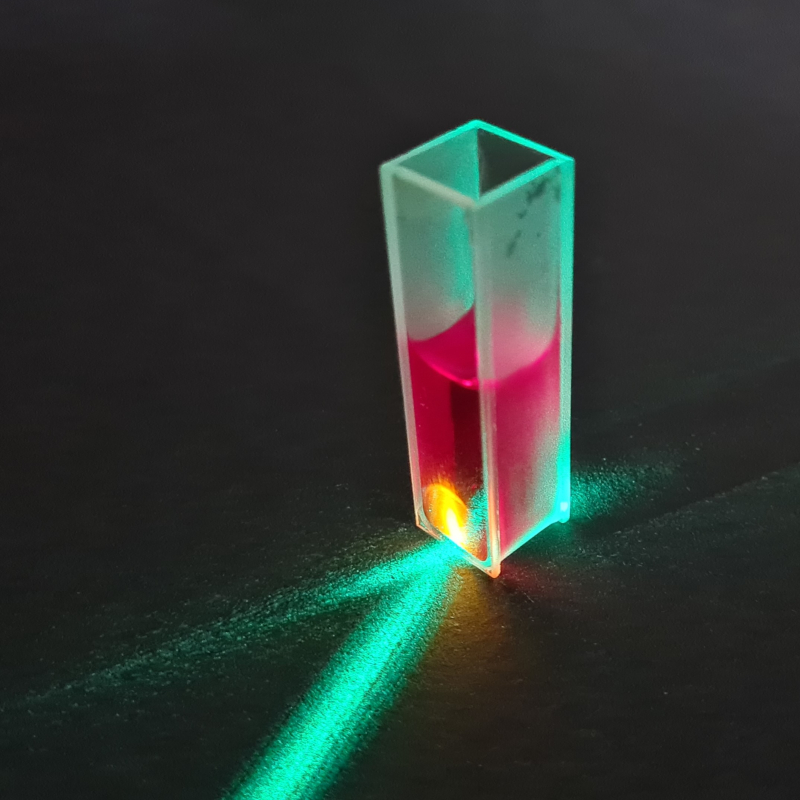
A transmission spectrum describes which wavelengths of light can pass through a material and which are absorbed. When white light hits a sample, some of it is swallowed up (absorbed) and the rest is allowed to pass through (transmitted). We can analyze this transmitted light with a spectrometer and thus obtain the characteristic spectrum of the sample.
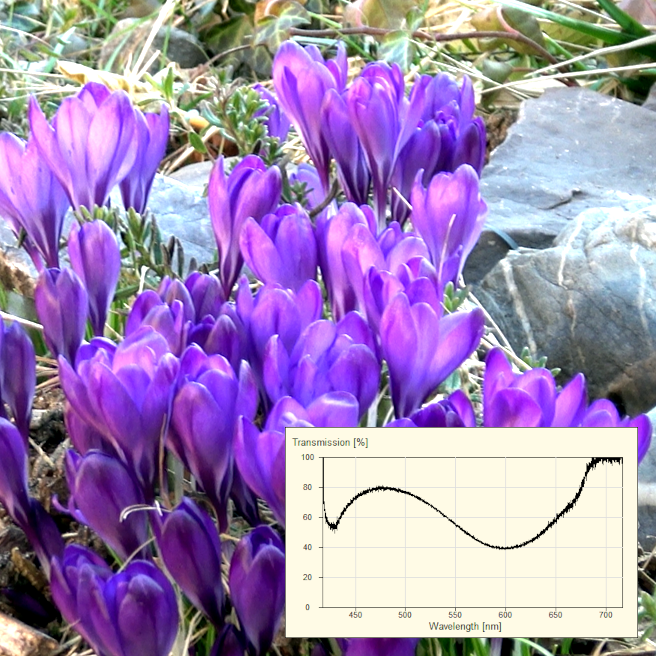
Examples of the measurement of transmission spectra include:
On a subpage we have compiled examples of some of the spectra we have recorded from this category of light sources.
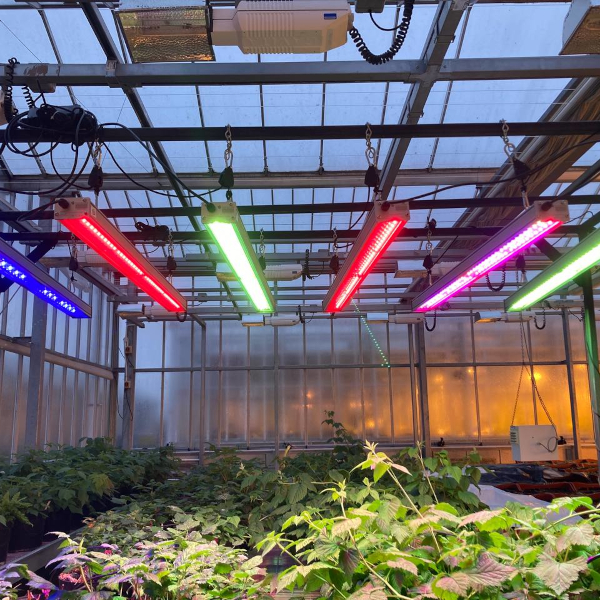
Semiconductor light sources such as LEDs generate light through electrical excitation in semiconductor materials. They are efficient, durable, and deliver precisely defined spectra from UV to infrared.
In this category, we show how to measure and analyze emission spectra with DIY spectrometers—ideal for research, teaching, and technical applications.
On a subpage we have compiled examples of some of the spectra we have recorded from this category of light sources.
¹ Kramida, A., Ralchenko, Yu., Reader, J., and NIST ASD Team (2023). NIST Atomic Spectra Database (ver. 5.11), [Online]. Available: https://physics.nist.gov/asd [2024, June 23]. National Institute of Standards and Technology, Gaithersburg, MD. DOI: https://doi.org/10.18434/T4W30F
A legend with more detailed information on the position of individual lines from this database is displayed in the spectra shown. A small letter is used to mark the line in the spectrum. In addition to the wavelength, the origin of the emission and the accuracy of the wavelength information are also indicated.
The meaning of the individual uncertainty classes is:
Here you can easily ask a question or inquiry about our products:
Last update: 2026-07-10

EURECA Messtechnik GmbH
Deutz-Kalker Straße 35, D-50679 Köln
![]()
![]() Phone: +49 (0)221 952629-0
Phone: +49 (0)221 952629-0
Fax: +49 (0)221 952629-9
info(at)eureca.de
www.eureca.de