

 MENU
MENU
Flower dyes, especially anthocyanins, show a fascinating behavior depending on solvent and pH value. In this application example, we demonstrate the transmission spectra of an aqueous solution of the flower dye of crocuses with our DIY spectrometer at different pH values.
The spectra were recorded with one of our DIY spectrometers.
A transmission measuring cell was built for the measurements using components from the 3D printer. In the middle of this cell there is a trough for holding a cuvette as a sample vessel. Toslink light guides can be inserted into two holders on either side so that they are exactly opposite each other and the cuvette is located between them. One of these Toslink light guides leads to the spectrometer, while the second is connected to a white light LED as a light source.
Transmissions-Messzelle
During the measurement, the white LED light first shines through the cuvette with its contents and then enters the spectrometer for analysis via the second light guide. First, a reference measurement is carried out with pure solvent, the signal of which is shown in red in the following spectra. The transmission of a solution in which flower dyes have been extracted is then measured. The respective transmission value is then calculated pixel by pixel as the quotient of the measured value and the reference value.
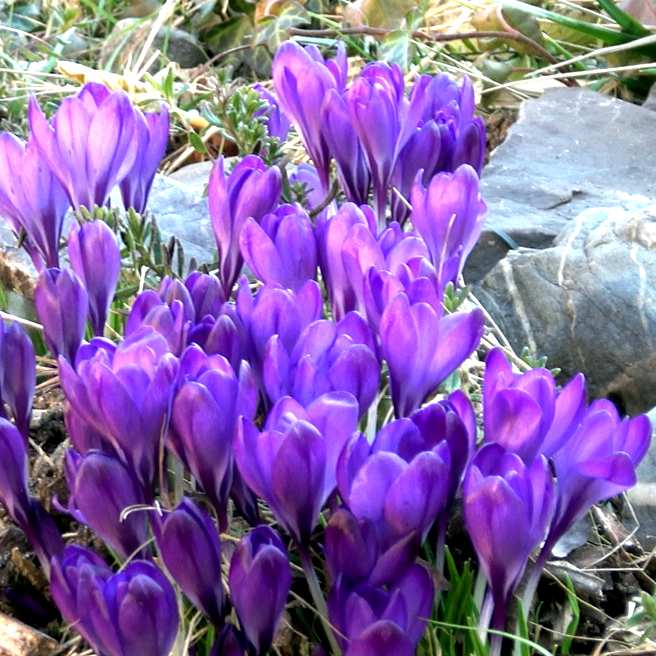
For sample preparation, fresh petals of violet crocuses were ground and the dyes dissolved in water. The pH value of this aqueous solution can later be adjusted as required by adding acid or a base. Without these additives, however, a bluish solution is initially obtained in water. (Incidentally, if isopropanol is used as a solvent instead of water, a violet solution is obtained, which also corresponds to the original color of the flowers).
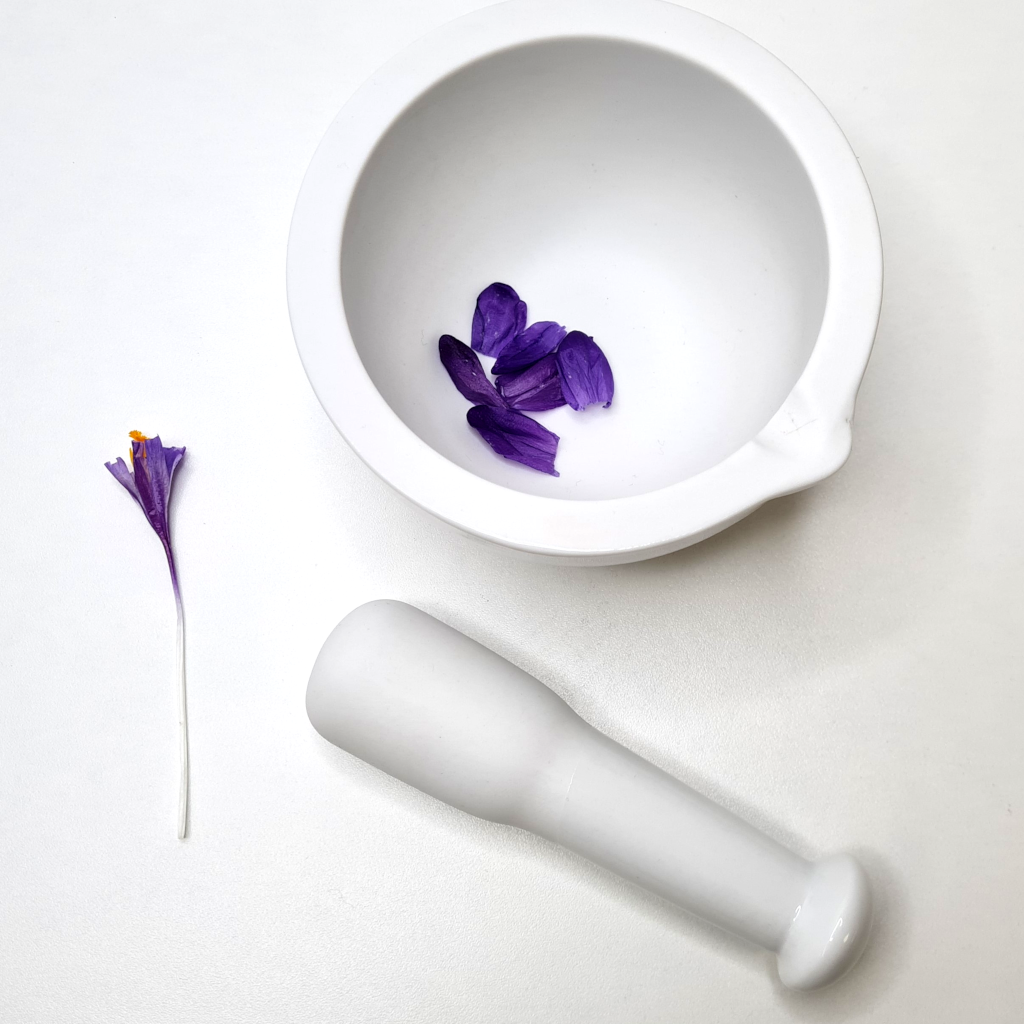
Mortar with violet petals
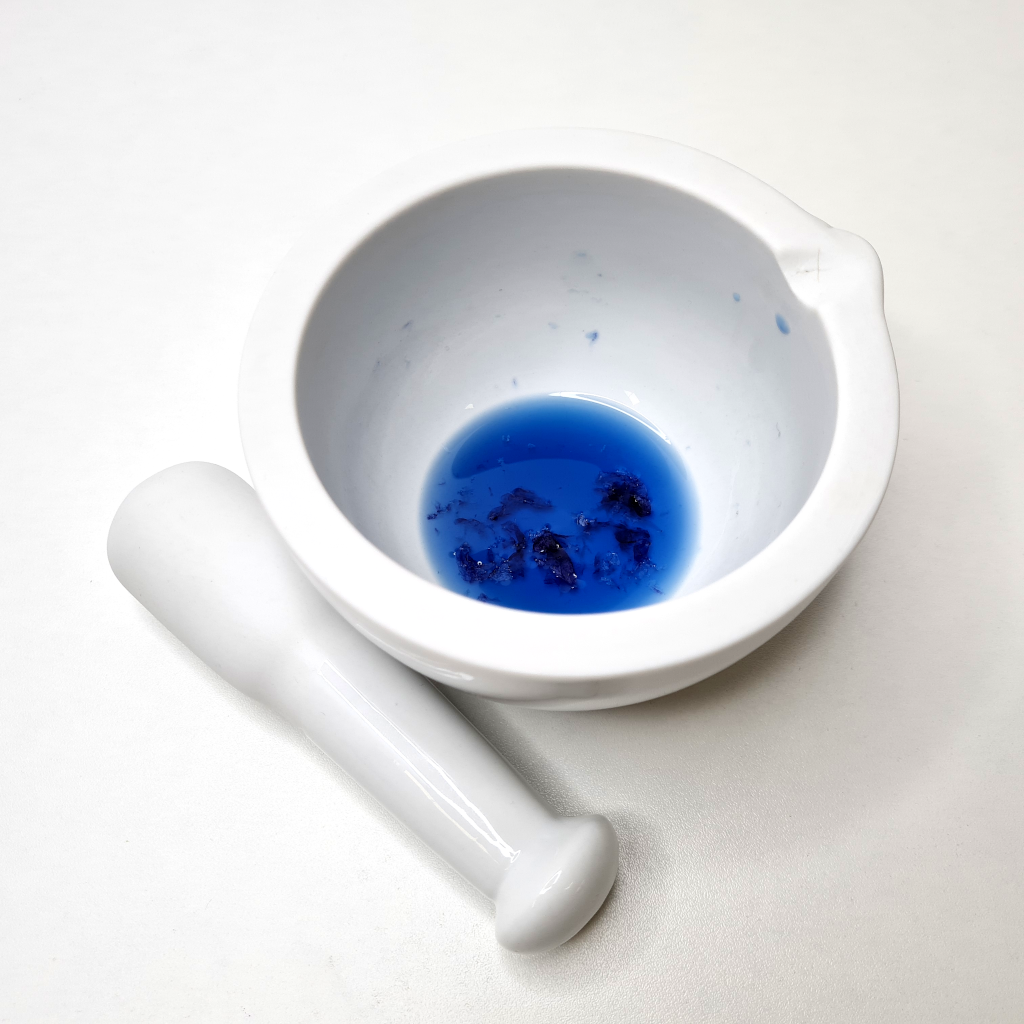
Ground petals in aqueous solution
For the measurement, the mortared solution is left to stand for a few minutes so that suspended particles settle. A few drops of this solution are then added to a cuvette and diluted again with water. The measurement with the spectrometer is very sensitive, so that even a very diluted solution is sufficient for meaningful measurement results.
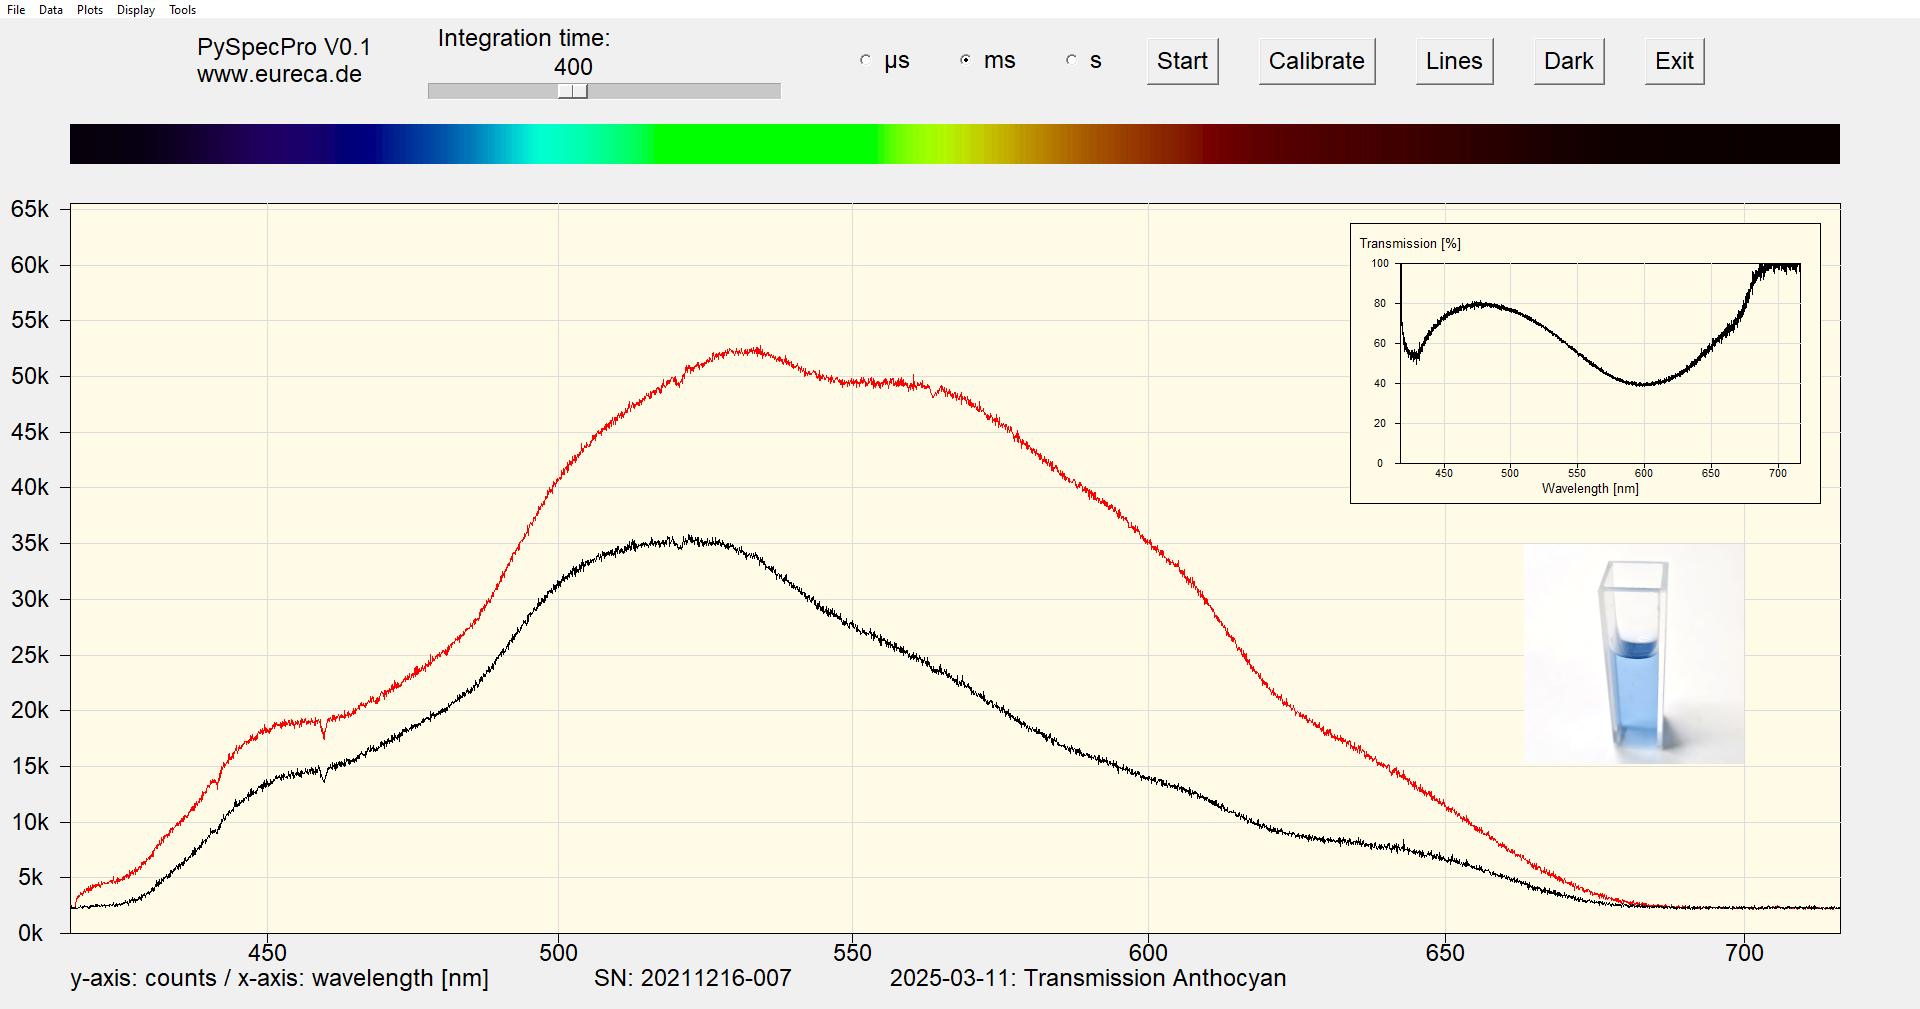
Spektrum des Krokusblütenextraktes in Wasser
The black curve shows the measured spectrum of the crocus solution and the red curve shows the reference spectrum of pure water. The transmission calculated from both signals is shown at the top right. A dip in the transmission means high absorption by the dyes in this spectral range. The sum of all absorbed or transmitted wavelengths then contributes to the coloration of the solution.
Here, the transmission spectrum shows that relatively strong absorption occurs in the reddish spectral range around 600 nm, while light in the bluish spectral range between 450 nm and 500 nm is transmitted much better. Although there are still reduced transmission values below 450 nm, this hardly contributes to color perception. Overall, this results in a bluish color of the solution.
If a few drops of an acid (such as citric acid) are added to the bluish solution of the blossom dye in the mortar, the original blue color turns reddish.
Again, wait for the suspended solids to sink and then add a few drops to another cuvette.
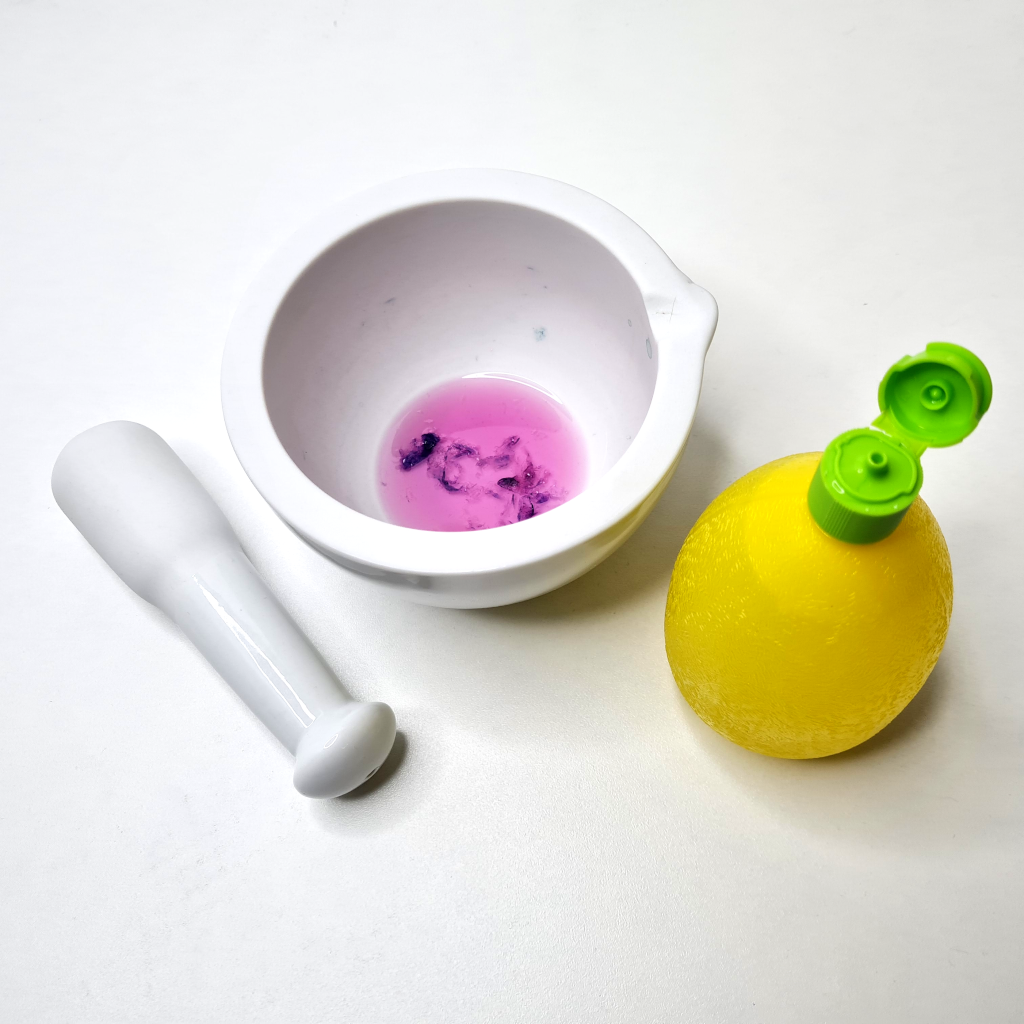
Ground petals in aqueous solution after addition of acid
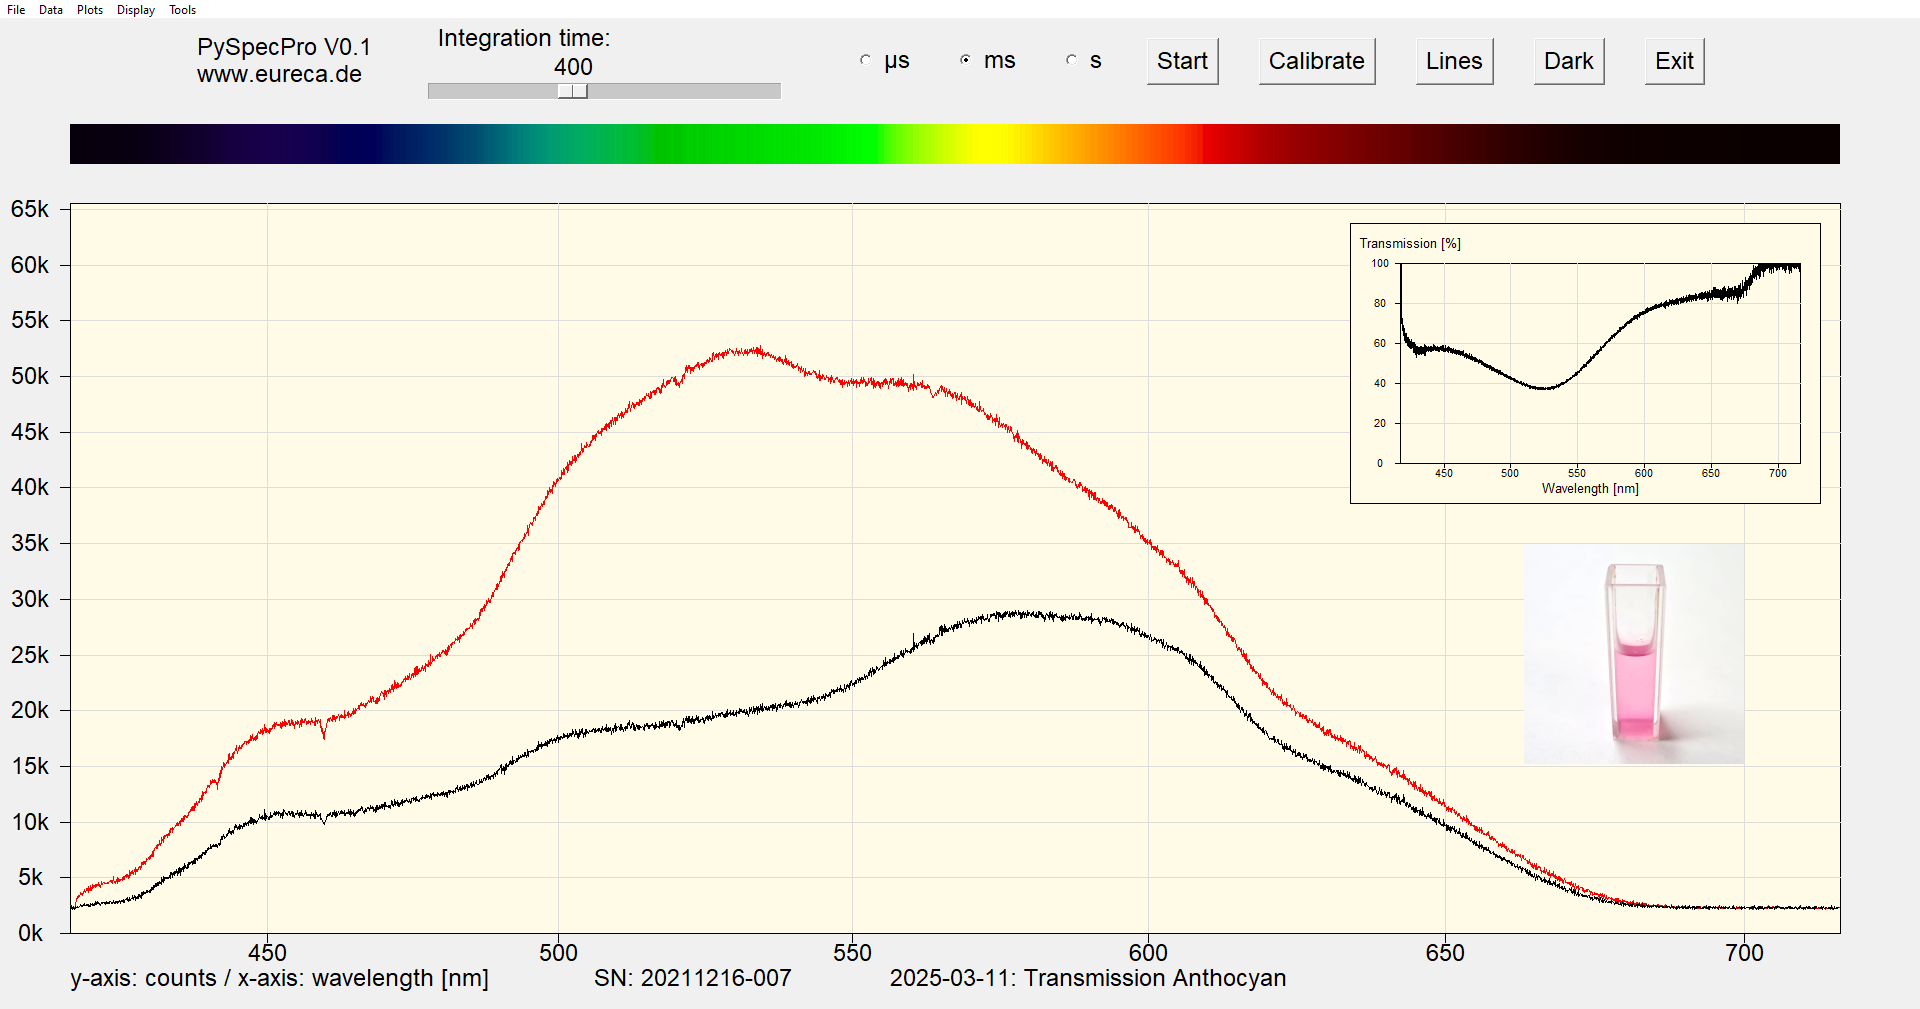
Spectrum of crocus flower extract in water after addition of acid
The transmission spectrum now shows a relatively high transmission in the red spectral range, while wavelengths below 600 nm are more strongly absorbed. Overall, this leads to the observed reddish coloration of the solution.
By adding a few grains of sodium hydroxide to the ground solution, the pH value can now be shifted to alkaline. The color of the solution changes to yellowish.
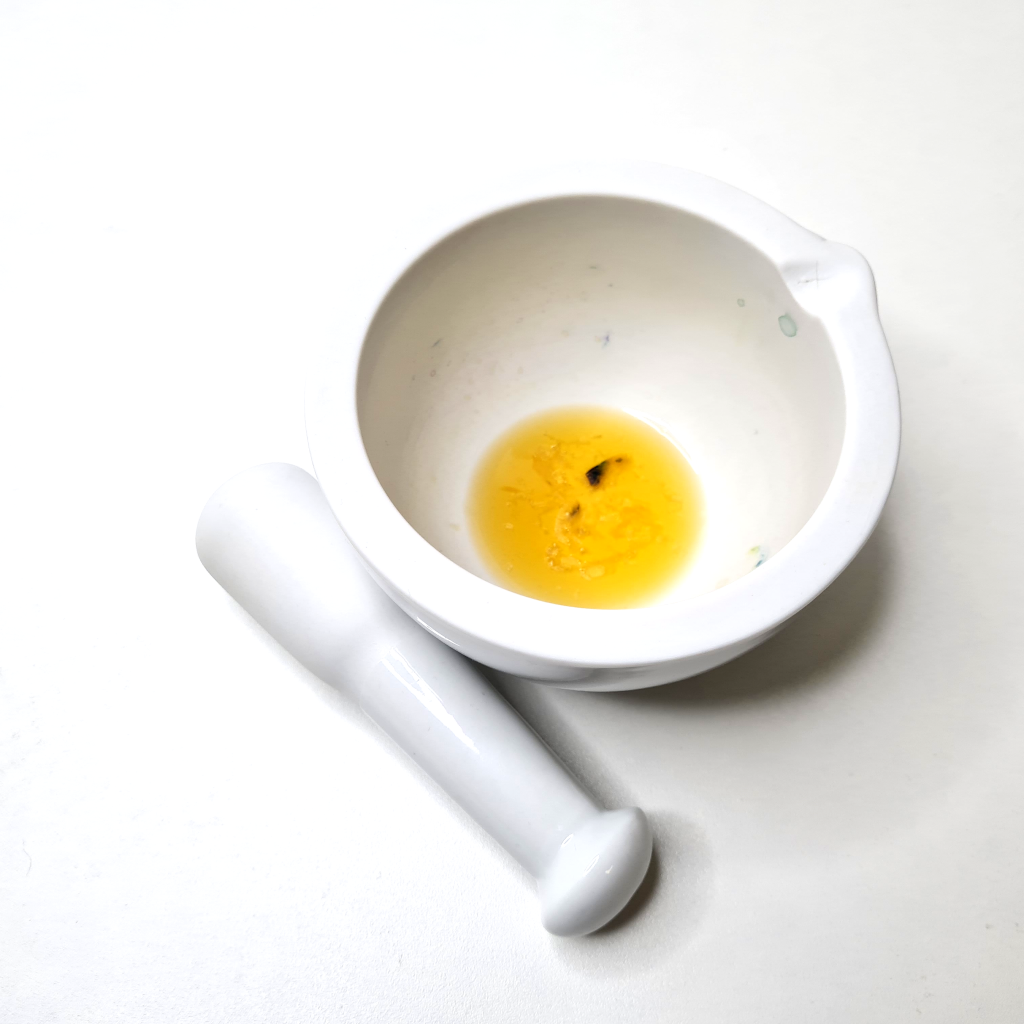
Ground petals in aqueous solution after addition of base
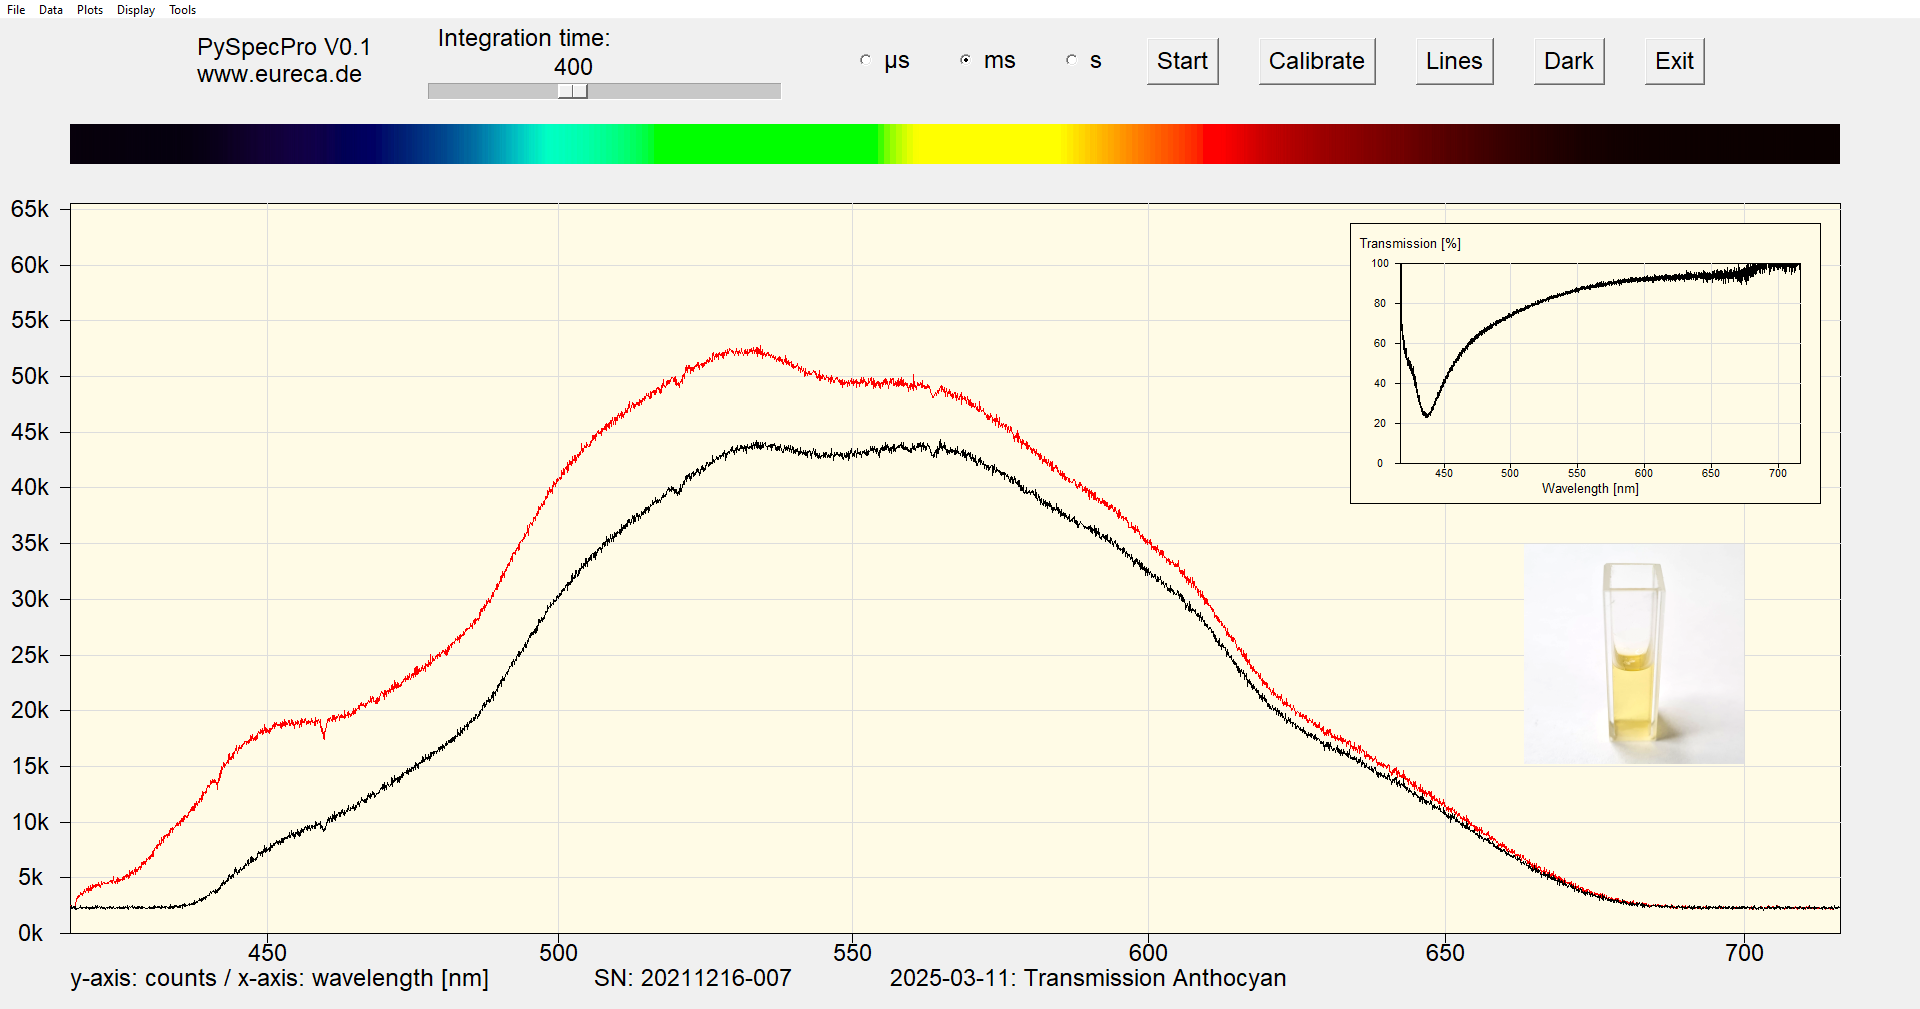
Spectrum of crocus flower extract in water after addition of base
In the transmission spectrum, a clear reduction in transmission is now observed in the blue spectral range. In the green and red spectral range, however, the transmission remains relatively high, which in total leads to the observed yellowish color of the solution.
If you would also like to carry out the experiment and need help setting up the spectrometer or carrying it out, please contact us. We are happy to help!

Anthocyanins are among the most important colorants in flowers and many other parts of plants. They are responsible for the impressive variety of colors in nature and show a remarkable sensitivity to their chemical environment—especially the pH value.
Anthocyanins are flavonoid pigments whose molecular structure changes depending on the pH value. These structural changes lead to different absorption properties and thus to color changes:
This pH dependency makes anthocyanins natural indicators. A practical example is red cabbage, whose colorants change from red to violet to green and yellow depending on the pH value.
Interestingly, the same anthocyanin pigment can produce different colors in different blossoms because the cell pH differs. Thus, cyanidin can appear red in one plant and purple or blue in another. A well-known example is the hydrangea, whose flower color is influenced by the pH value of the soil.
In addition to the pH value, the type of anthocyanin also determines the color of a blossom. The most important anthocyanins are
Most flowers contain a mixture of different anthocyanins, which together with other factors such as co-pigmentation and metal ions determine the final color.
In addition to anthocyanin type and pH value, there are other mechanisms that influence blossom color:
The pH sensitivity of anthocyanins is used in many areas:
Anthocyanins are a fascinating class of substances that are not only responsible for the diversity of colors in nature, but also offer numerous practical applications. Their pH-dependent behavior enables exciting experiments and insights into the interactions between molecules and their environment.
 Would you like to replicate the experiment—in your laboratory or teaching environment? Feel free to contact us—we will assist you with planning, setup, calibration, and selecting the right components. Eureca offers advice based on many years of expertise in optoelectronics, optics and spectroscopy—from DIY setups to OEM solutions. Feedback is expressly welcome: Please share your experiences, results, or suggestions for improvement with us.
Here you can easily ask a question or inquiry about our products:
Last update: 2025-10-31

EURECA Messtechnik GmbH
Deutz-Kalker Straße 35, D-50679 Köln
![]()
![]() Phone: +49 (0)221 952629-0
Phone: +49 (0)221 952629-0
Fax: +49 (0)221 952629-9
info(at)eureca.de
www.eureca.de


