

 MENU
MENU
Almost every white light LED package has a Kelvin rating, such as 3000 K, 4000 K, or 5000 K. This so-called color temperature describes the impression we humans have of the light from an LED.
An LED with 5000 K appears warm white and is reminiscent of the light from an incandescent bulb, while 4000 K appears neutral white. At 5000 K, the light is perceived as cool white, similar to daylight in the morning.
In this application example, we look at the spectra of different white light LEDs with our microspectrometer and show how these differences can be clearly measured and displayed.
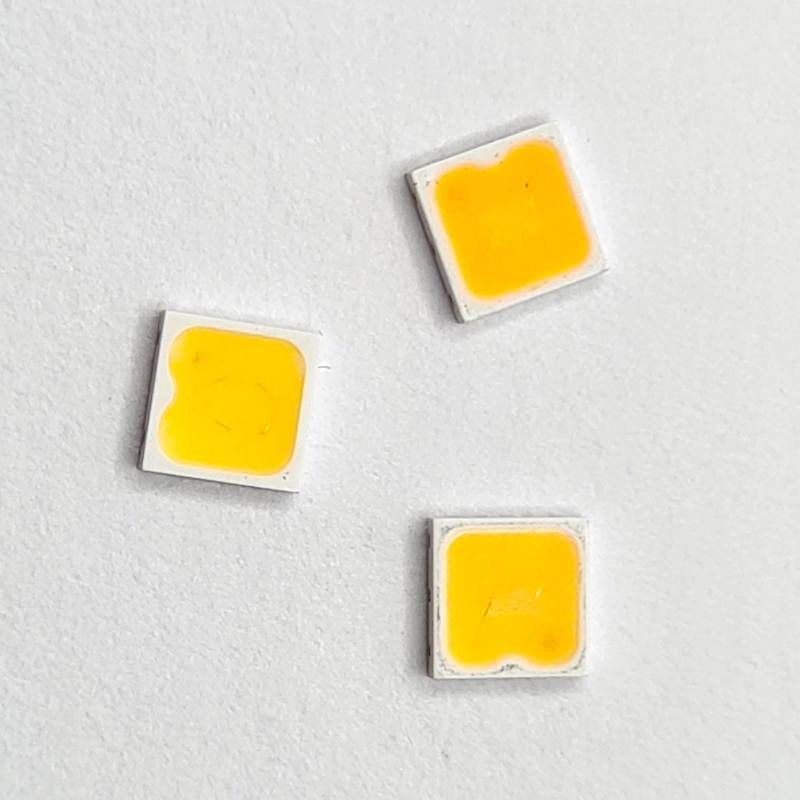
White light LEDs in SMD design
An LED does not naturally emit white light. Semiconductor LEDs initially only emit light within a narrow wavelength range, such as blue or violet light. To produce white light, some of this short-wave light is converted by special phosphors. These materials absorb some of the blue LED light and re-emit it in longer wavelengths—i. e., green, yellow, or red light.
The human eye perceives the mixture of direct blue LED light and the long-wave light produced by phosphors as white LED light. Depending on the composition of the phosphors, the color temperature can be specifically adjusted: A high red component produces warm white LED light (low Kelvin values such as 2700 K or 3000 K), while a higher blue component results in cool white light (e. g., 5000 K or 6000 K).

The Kelvin scale originally comes from the physics of black bodies. This term refers to ideal bodies that emit light in a very specific spectrum when heated. The hotter this so-called black body is, the more its light shifts toward blue, while cooler temperatures tend to produce reddish light. The »color perception« of a light source can thus be described by comparing it to such a glowing body. Of course, an LED is not a perfect black body, because its light is generated by semiconductor processes and often additionally by phosphors. Nevertheless, its light color can be roughly characterized by a corresponding color temperature.
In very simple terms, the color temperature is calculated by comparing the measured spectrum with the color scale that a heated black body would emit at different temperatures. On a special color chart, known as a color diagram, the point closest to the perceived light color is sought and assigned a temperature in Kelvin. This yields values such as 3000 K, 4000 K, or 5000 K, which we find on lamp packaging.
We deliberately used our microspectrometer for our measurements rather than the DIY Czerny-Turner spectrometer with its higher spectral resolution. The reason for this lies in the purpose of the application: when observing LED spectra, the aim is not so much to resolve fine line structures or narrow peaks in detail, but rather to represent the rough spectral composition across the entire visible range. The microspectrometer delivers results very quickly and reliably and, thanks to its compact design and ease of use, is ideal for use in the classroom. Especially when conducting experiments with students and interns, it is advantageous to be able to take measurements without tedious adjustments and with immediately understandable displays.
The diagrams shown also feature not just a simple line, but a colored representation that shows each wavelength in the visible range with its own color. So instead of just presenting a curve, the spectrum is displayed as a kind of bar chart: a colored bar rises above each wavelength, with its height indicating the intensity of the light at that point. This creates a colorful image that makes it immediately apparent at first glance which areas of the spectrum are particularly strongly represented.
This form of visualization is particularly helpful for beginners, as the abstract measurement data is directly linked to the colors that our eyes perceive. You can immediately see whether the red range is more pronounced, whether there is a lot of green or blue, and how the entire light spectrum is composed. The bar display is therefore highly recognizable and, at the same time, a strong eye-catcher that makes the measurement results not only scientifically correct but also intuitively understandable.
We measured three LEDs from the same series by one manufacturer—types with 3000 K, 4000 K, and 5000 K respectively. These images clearly show that the spectral composition of the light changes, even though all three LEDs initially appear »white« to the eye.
The spectrum of a 3000 K LED has a significantly higher proportion of red and yellow light in the visible light range. These long-wave components ensure that the light appears particularly soft and comfortable to our eyes. We are familiar with this effect from classic incandescent bulbs, whose filaments also emit a lot of red and yellow light, or from romantic sunsets. This is why warm white LED light has a cozy and pleasant effect and is preferred in living rooms, restaurants, or anywhere else where a cozy, relaxed atmosphere is desired.

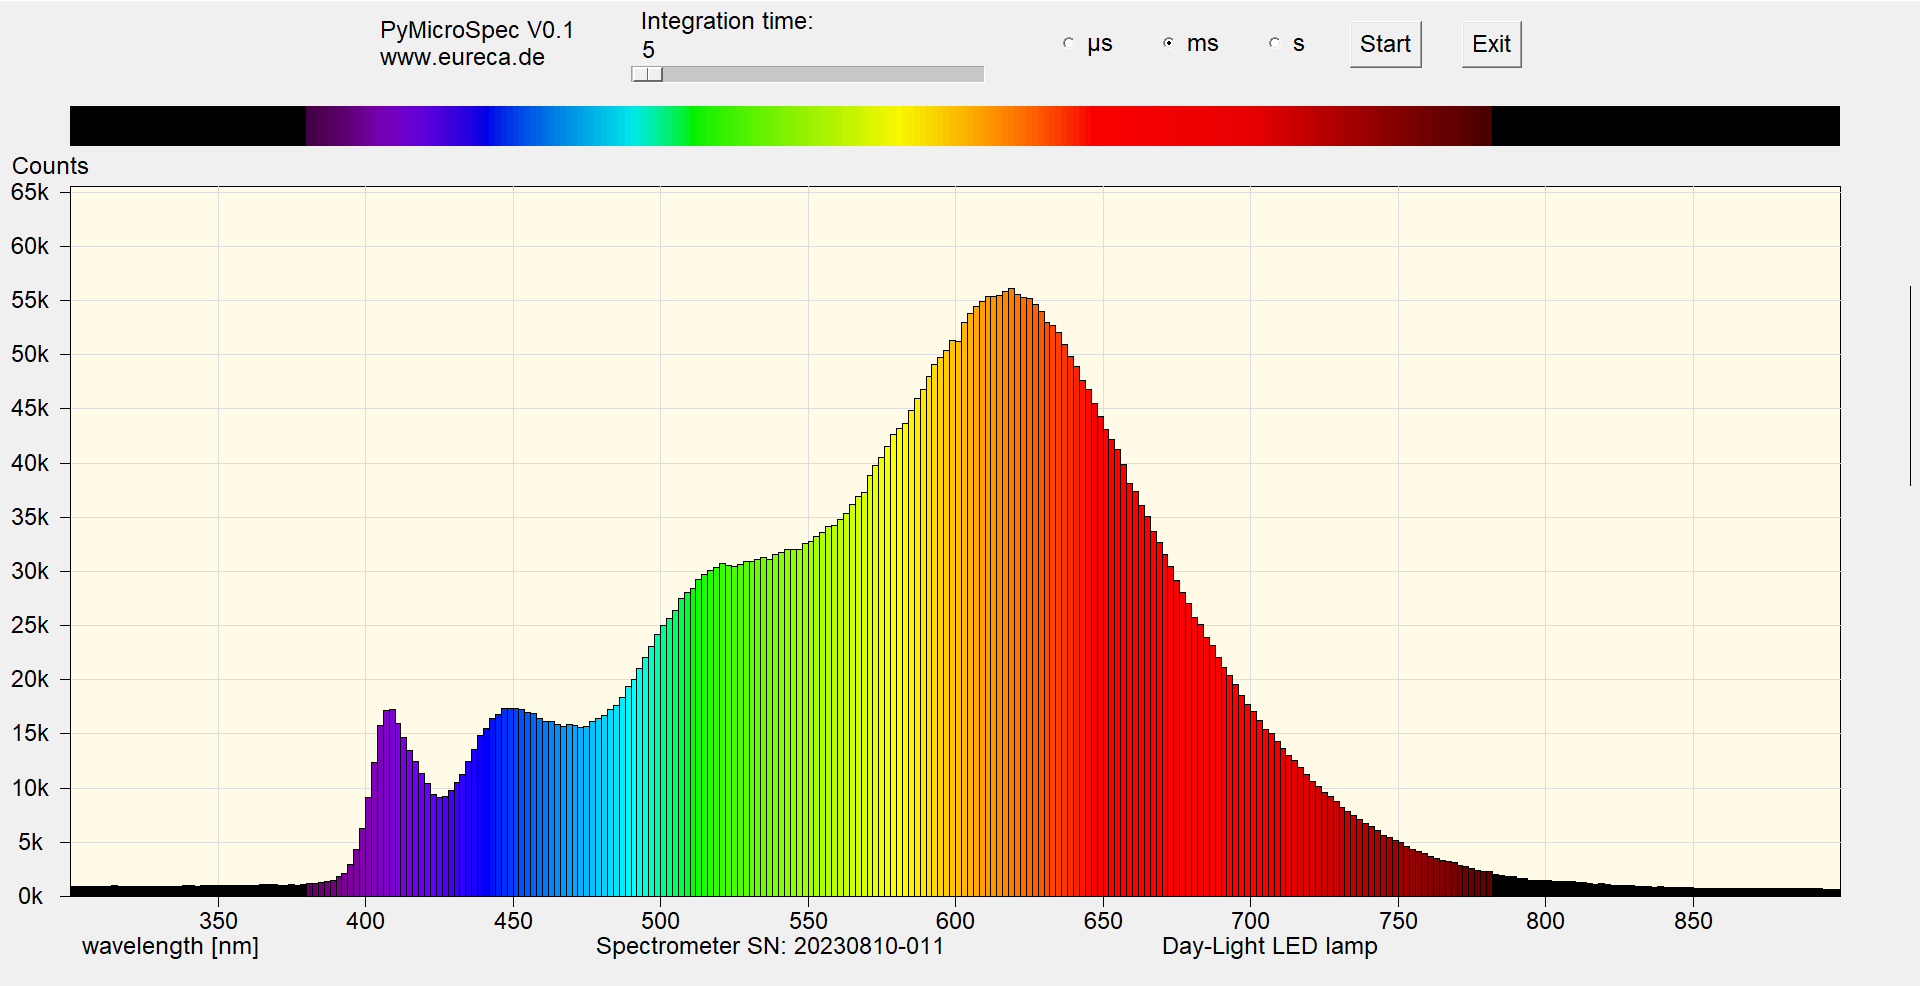
Colorized spectrum of a white light LED 3000 K
With a 4000 K LED, the spectrum is much more balanced. The proportions of blue, green, and red are roughly equal, so that no single color stands out particularly strongly. To our eyes, this light appears neutral and clear, without a yellowish or bluish tint. That is why it is referred to as »neutral white«. In practice, neutral white light is particularly well suited for work areas, classrooms, workshops, or offices, as it allows the surroundings to appear true to color while promoting a focused, businesslike atmosphere.
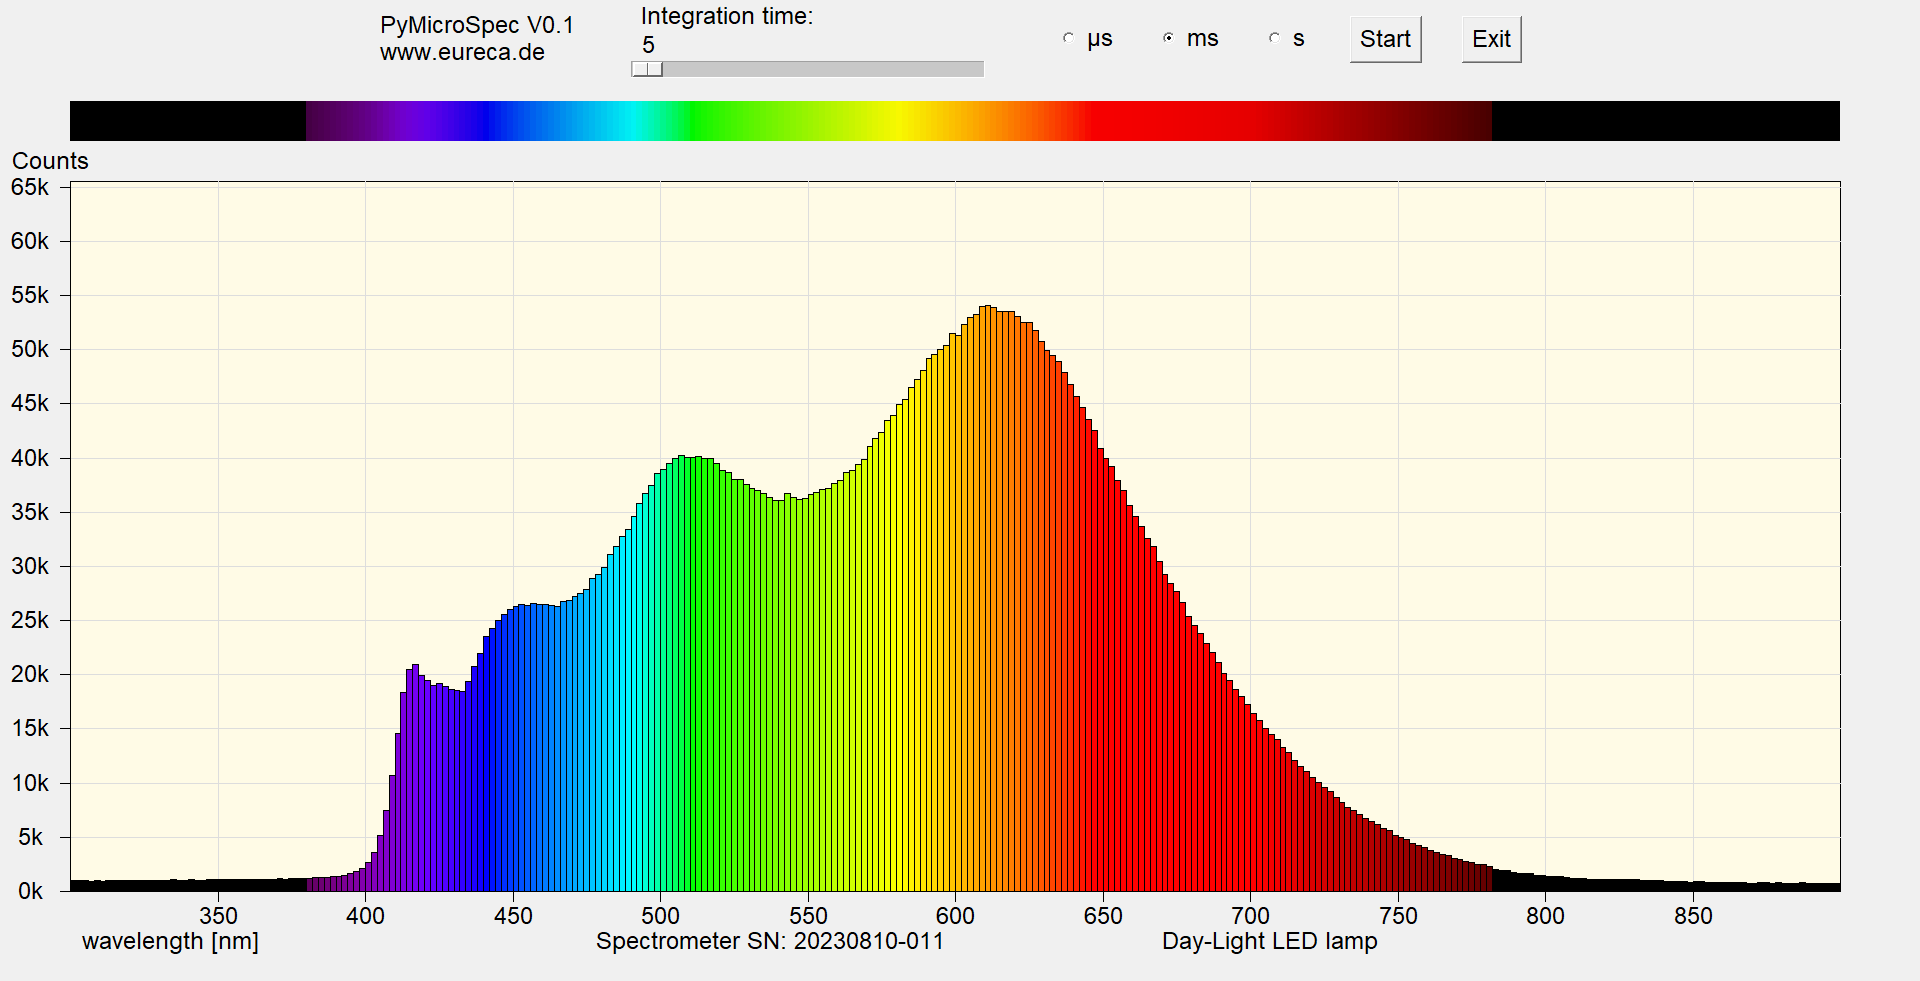
Colorized spectrum of a white light LED 4000 K
An LED with 5000 K has a significantly higher proportion of blue in its spectrum. This makes the light appear particularly bright, fresh, and stimulating to our eyes. The overall impression is similar to daylight in the morning, which makes us feel awake and alert. This type of cool white light is therefore often used in offices, laboratories, or schools, where concentration and a clear perception of the environment are important. It is also used in sales rooms or exhibitions, as colors appear very contrasting and unaltered under cool white light.

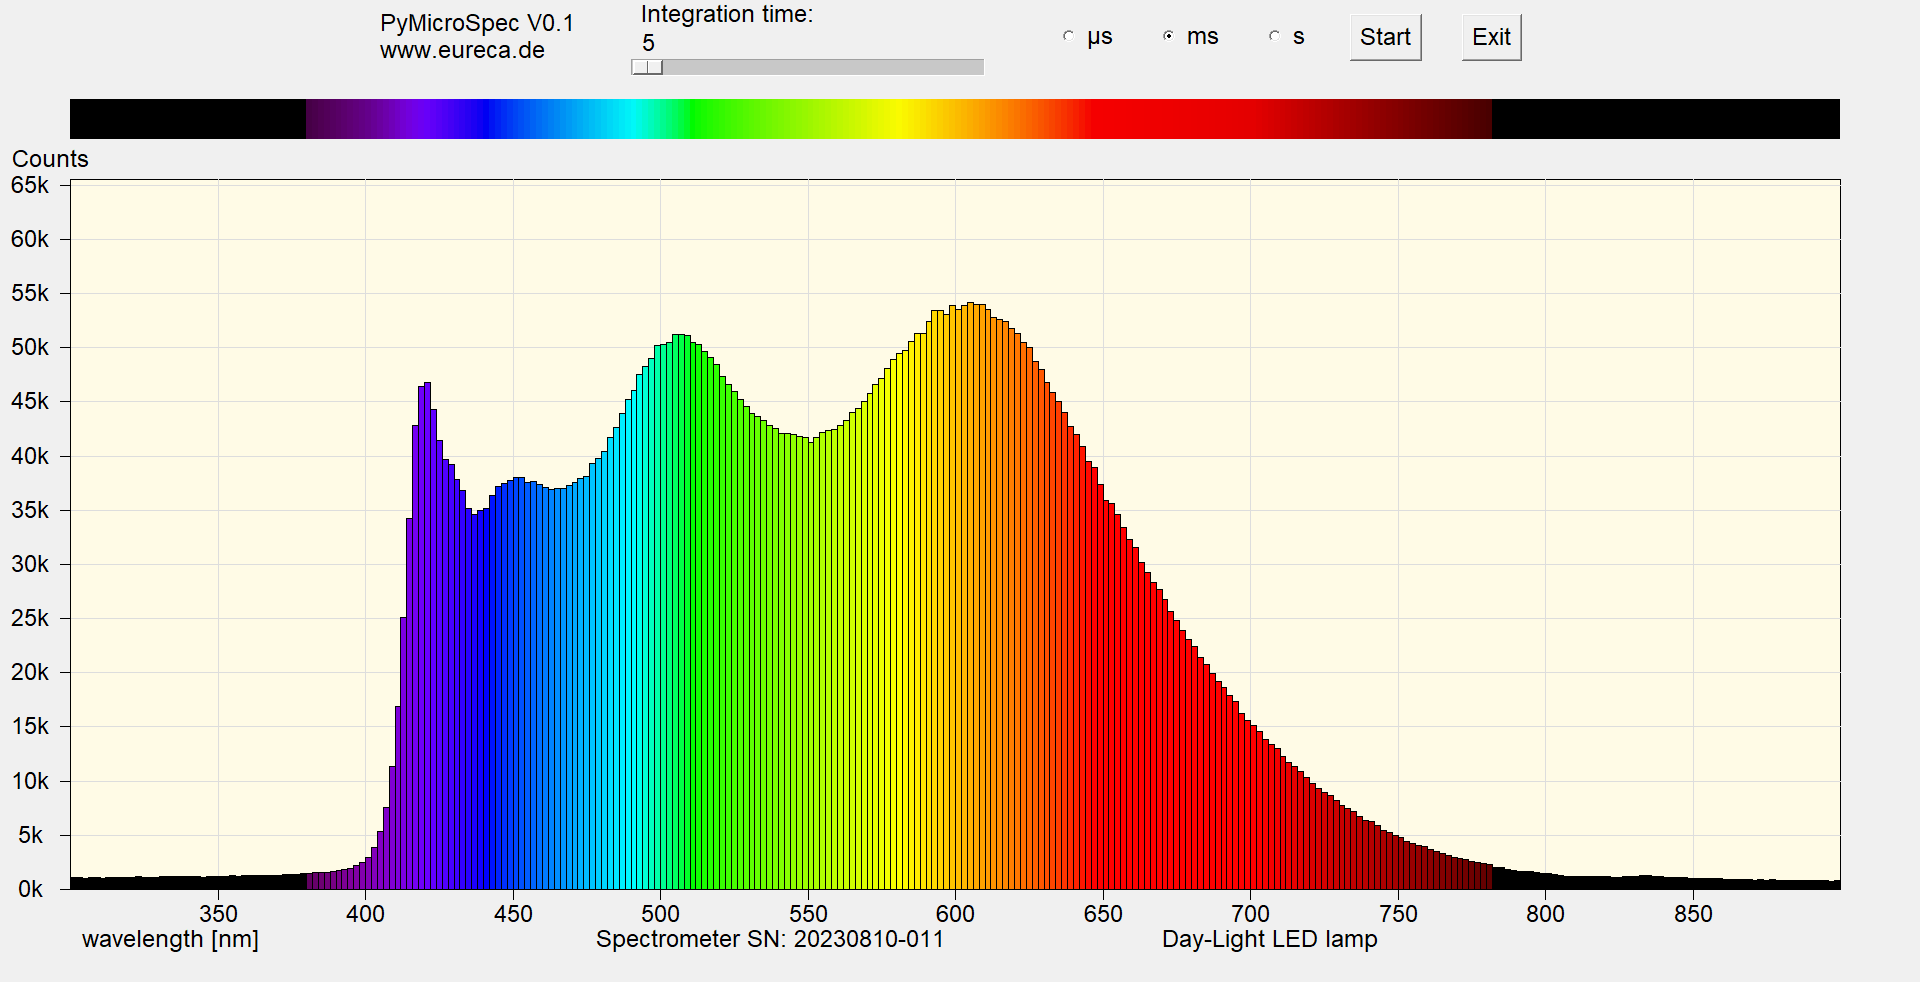
Colorized spectrum of a white light LED 5000 K
The spectra shown in this application example are raw data from our microspectrometer. This means that they have not yet been spectrally corrected, i. e., the sensitivity differences of the detector across different wavelengths have not been taken into account. However, such a correction is not absolutely necessary for a rough classification of color temperatures, as the typical differences between warm white, neutral white, and cool white LED light are clearly visible even without complex post-processing. It is precisely this immediacy that makes the experiment particularly illustrative for use in teaching.
In the next application example, we will go one step further and show how spectral correction can be performed. This allows the recorded data to be interpreted even more accurately and also directly compared between different devices. In this way, we can illustrate the transition from a simple, vivid demonstration to precise, scientifically reliable measurements—and highlight the practical benefits of the spectrometer for both education and research.
The spectral analysis of LEDs is not only an exciting teaching and demonstration experiment, but also has high relevance in industrial practice. Modern LED lighting systems today must meet strict quality requirements—from color rendering to long-term stability.
Our microspectrometers allow such issues to be investigated quickly and reliably:
Compliance with specifications: Whether color temperature ranges, color coordinates, or spectral intensity distributions—a measurement setup based on our spectrometers makes it easy to check whether the delivered LEDs comply with the specified values.
Development of new lighting concepts: Spectral analysis plays a key role in research and development. Whether human-centric lighting, plant lighting, or displays—a precise understanding of the LED spectrum is the basis for innovative applications.
In addition, thanks to their compact design and flexible control, the microspectrometers are also suitable for mobile use in the field or as an integrated solution in test benches and laboratory equipment. They thus combine ease of use with the performance of professional spectroscopy.
 Would you like to replicate the experiment—in your laboratory or teaching environment? Feel free to contact us—we will assist you with planning, setup, calibration, and selecting the right components. Eureca offers advice based on many years of expertise in optoelectronics, optics and spectroscopy—from DIY setups to OEM solutions. Feedback is expressly welcome: Please share your experiences, results, or suggestions for improvement with us.
Here you can easily ask a question or inquiry about our products:
Last update: 2025-10-31

EURECA Messtechnik GmbH
Deutz-Kalker Straße 35, D-50679 Köln
![]()
![]() Phone: +49 (0)221 952629-0
Phone: +49 (0)221 952629-0
Fax: +49 (0)221 952629-9
info(at)eureca.de
www.eureca.de


