

 MENU
MENU
With a spectrometer of sufficient resolution, the Fraunhofer lines in the solar spectrum can easily be made visible. These absorption lines allow conclusions to be drawn about the chemical composition of the gas atmosphere of the sun as well as that of the earth's atmosphere. The evaluation of such lines is one of the most important tools in astronomy, also in the spectrum of other stars.
Such lines in the solar spectrum were systematically examined by Joseph von Fraunhofer starting in 1814, from whom they also got their name.
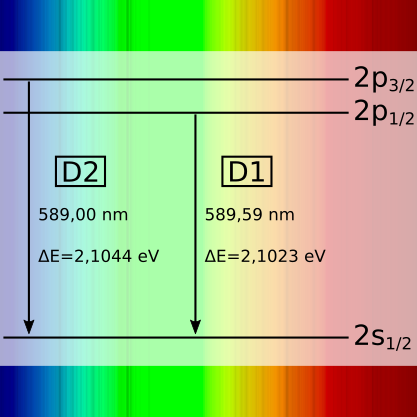
Simplified term scheme Na-D lines
The sun, with its surface temperature of around 6 000 Kelvin, emits light as a Planck emitter with a continuous spectrum that extends over a large wavelength range. However, certain wavelengths are weakened by resonance absorption of gases on the way of the light to the observer and then show up as dark lines in the spectrum.
The Fraunhofer C, F, G' and h lines correspond to the alpha, beta, gamma and delta lines of the Balmer series of a hydrogen atom. The lines A, B, a, Y and Z are not of solar but terrestrial origin, which means they are formed by absorption in the earth's atmosphere.
| Designation | Element | λ [nm] |
|---|---|---|
| A | O2 | 759,370 |
| B | O2 | 686,719 |
| C | Hα | 656,281 |
| a | O2 | 627,661 |
| D1 | Na | 589,594 |
| D2 | Na | 588,997 |
| D3 or d | He | 587,562 |
| E2 | Fe | 527,039 |
| b1 | Mg | 518,362 |
| b2 | Mg | 517,270 |
| b3 | Fe | 516,891 |
| b4 | Fe | 516,751 |
| b4 | Mg | 516,733 |
| c | Fe | 495,761 |
| F | Hβ | 486,134 |
The measurements shown here were recorded with the spectrometer that we presented in the »Czerny-Turner spectrometer application example«.
The sunlight is coupled into the spectrometer by simply holding the light guide in the direction of the sun and selecting the appropriate integration time. In order to pack the spectrometer in a portable but still light-tight manner, a spectrometer housing was built from MDF cuts and assembly parts from the 3D printer.
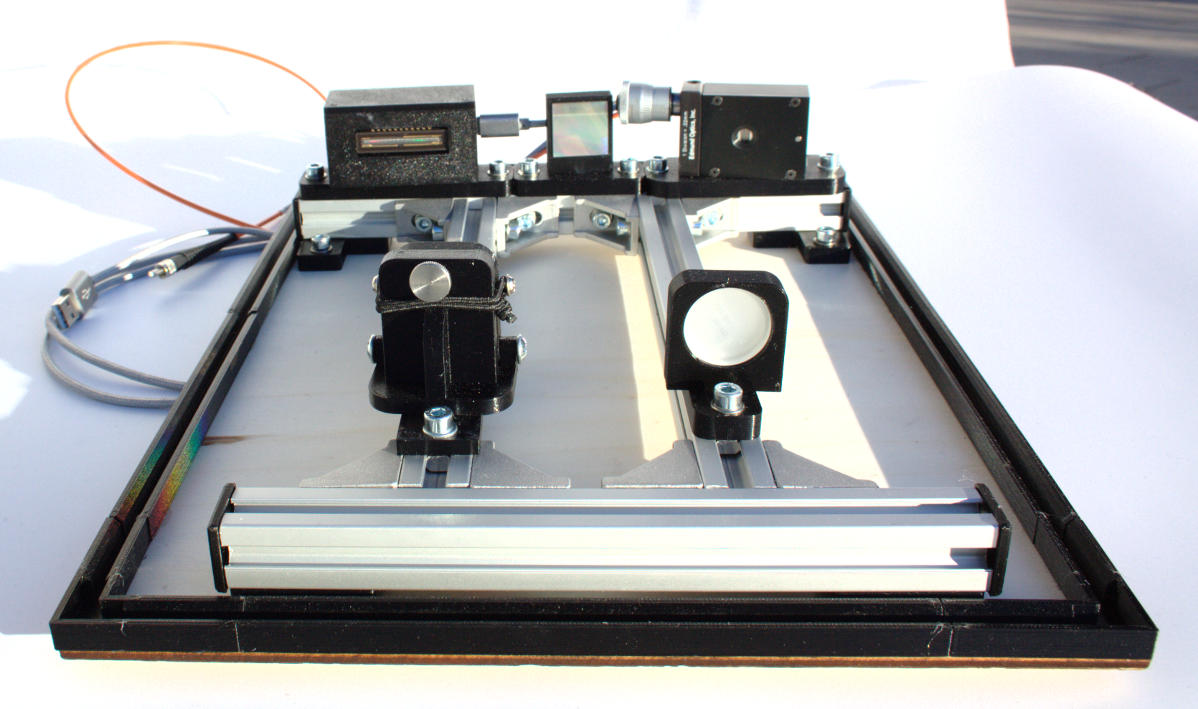
Spectrometer in an open housing
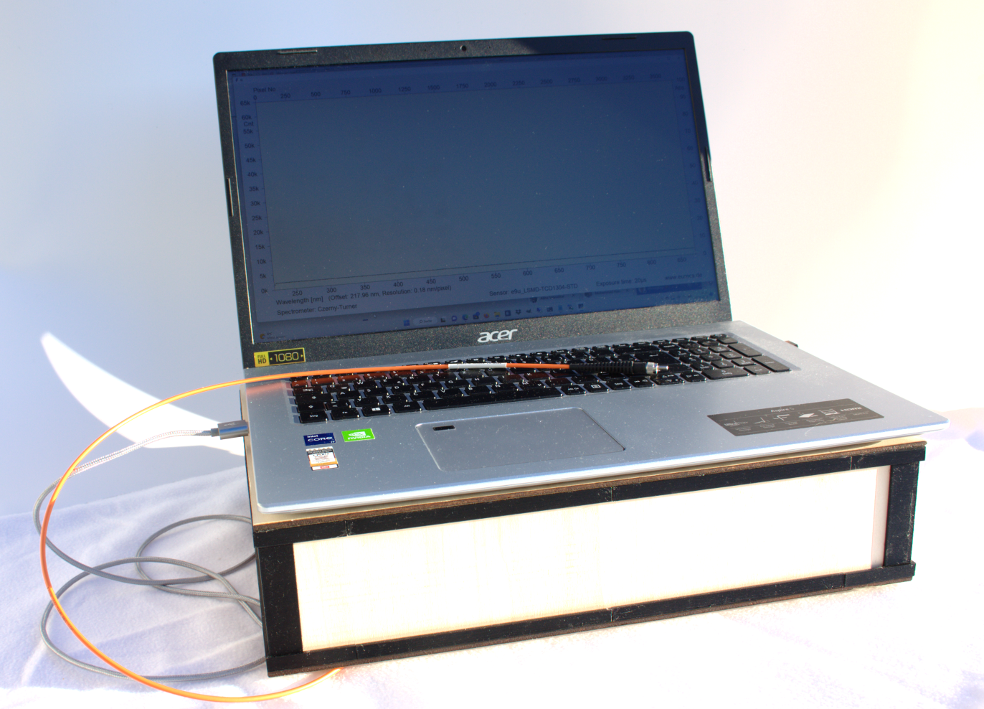
Laptop on closed spectrometer housing
We can provide tips and assistance for replication on request.
The spectrum shows the unprocessed raw data from the sensor. Due to the fact that the sensor has not yet been spectrally calibrated, the spectrum does not quite follow the expected form of a Planckian radiator. However, the most important Fraunhofer lines show up very clearly as dips in the sensor signal.
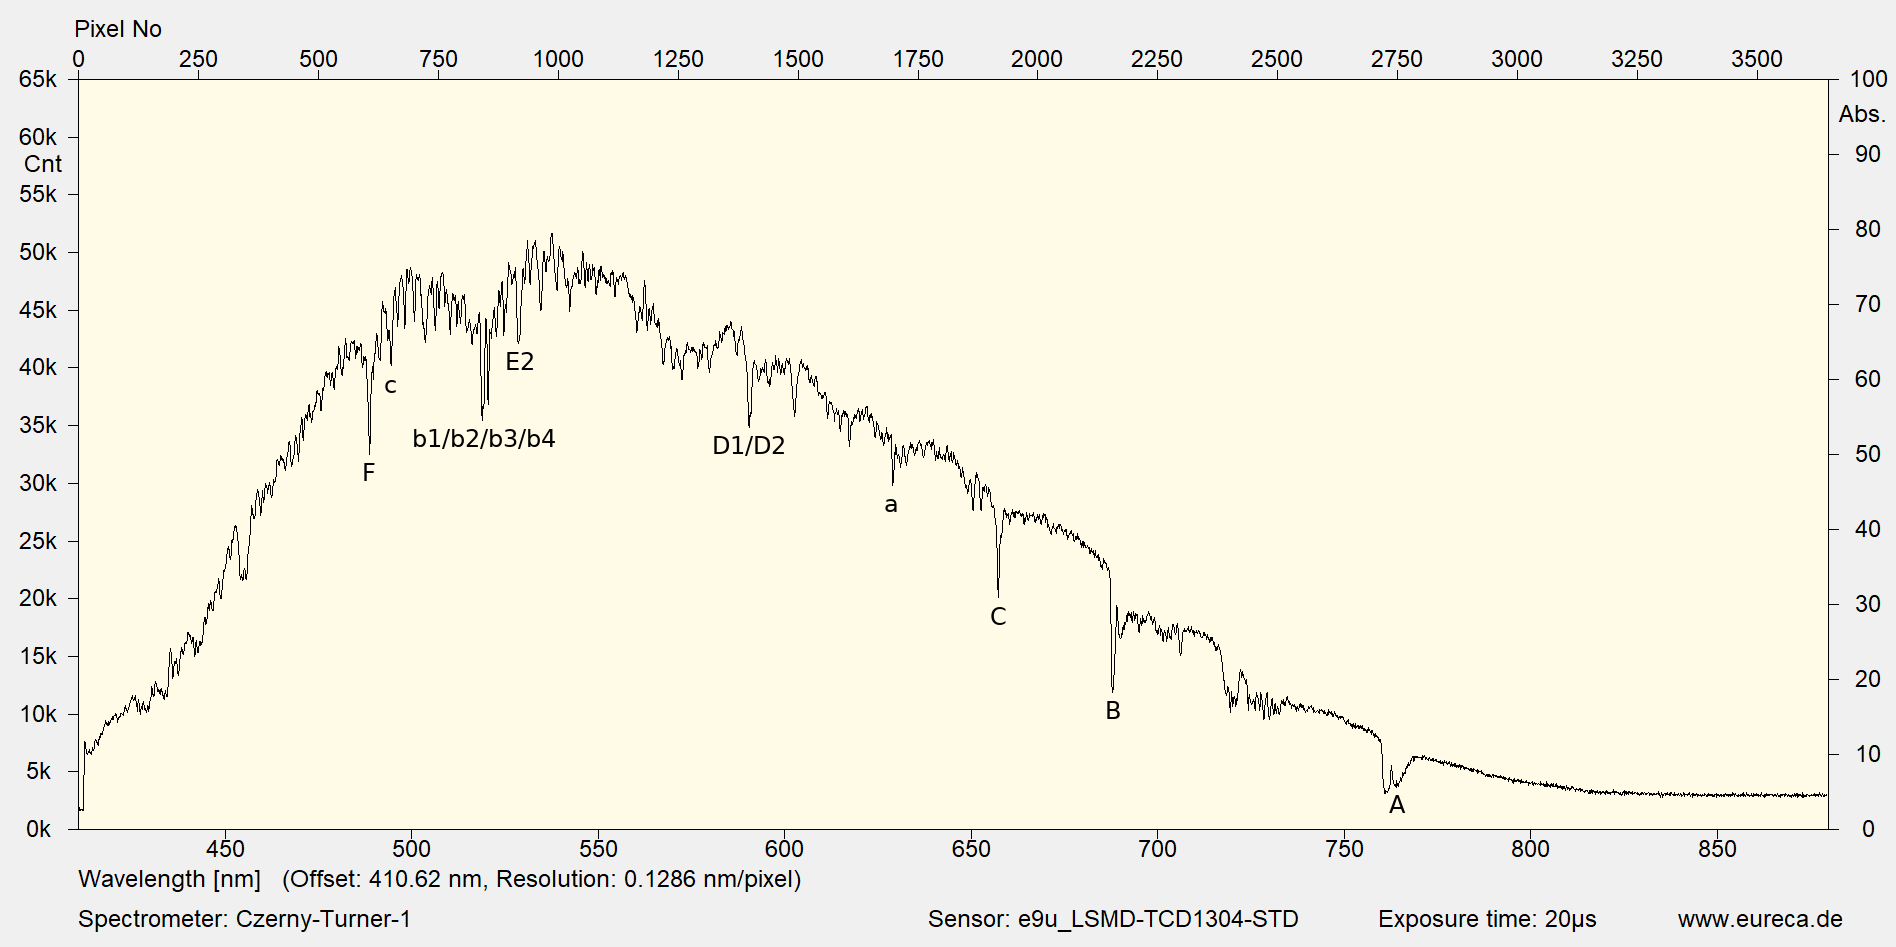
Solar Spectrum
The recorded data can be quite easily converted into a graph similar to the view seen through a telescope equipped with a spectrometer. For this purpose, the color of the respective wavelengths that the human eye perceives for each pixel of the spectrometer is determined and a vertical line is drawn with it. The Fraunhofer lines then appear as dark lines in this representation.

Fraunhofer lines
The example of the solar spectrum offers, among other things, the following starting points for use in teaching:
You will also find this information handy for printing in this PDF.
As the color of the perceived light changes depending on the position of the sun, this is also suitable as a question for a spectrum. We provide some sample spectra here.
Are you also involved in teaching science to young people? We are happy to hear from anyone who would like to use our DIY spectrometers in educational contexts or supplement their own projects with our application spectra. Feel free to contact us to discuss possible forms of collaboration.
We are gradually presenting some examples of current collaborations here—perhaps they will inspire you to start a joint project?

On the website Astrophysik-für-Einsteiger (German only) you will find scripts on astronomical topics, which are intended for self-study for pupils and first-year students and for course instructors and teachers for quick familiarization or as an aid to preparing astronomy courses.
 Would you like to replicate the experiment—in your laboratory or teaching environment? Feel free to contact us—we will assist you with planning, setup, calibration, and selecting the right components. Eureca offers advice based on many years of expertise in optoelectronics, optics and spectroscopy—from DIY setups to OEM solutions. Feedback is expressly welcome: Please share your experiences, results, or suggestions for improvement with us.
Here you can easily ask a question or inquiry about our products:
Last update: 2025-10-31

EURECA Messtechnik GmbH
Deutz-Kalker Straße 35, D-50679 Köln
![]()
![]() Phone: +49 (0)221 952629-0
Phone: +49 (0)221 952629-0
Fax: +49 (0)221 952629-9
info(at)eureca.de
www.eureca.de


