

 MENU
MENU
Many of the spectra we have recorded so far have focused on narrow, well-defined emission lines: noble gases, mercury vapor, or metals such as sodium, potassium, or barium (in our spectra of fireworks) produce characteristic line patterns that are ideal for calibration, spectral analysis, or explaining atomic energy levels.
However, the situation is different for a glow lamp filled with a molecular gas. Here, distinct maxima are also visible in the spectrum, but these maxima are not simple atomic emission lines. Instead, the spectrum is dominated by the so-called band spectra of the respective molecule.
AI Info
That is precisely what makes this measurement so fascinating: it shows that molecules are spectroscopically much »richer« than individual atoms. In addition to electronic transitions, the molecule’s vibrations and rotations also play a role. Individual transitions thus form a whole bundle of closely spaced lines—and in the spectrometer, this bundle appears as a characteristic band.
However, the visual impression of color is only a rough summary. The spectrometer reveals the actual structure behind it: what appears to be a uniform violet glow turns out to be an entire landscape of molecular transitions. This is one of those beautiful moments in spectroscopy: the eye says »violet«. The spectrometer says, »Sit down, we need to talk.«
As an introduction to this topic, we’re sharing spectra here that were recorded using our DIY spectrometers on a nitrogen-filled glow lamp. Spectra from glow lamps filled with other gases (including carbon dioxide, hydrogen, deuterium, and oxygen) will follow shortly. Follow us on Instagram or LinkedIn if you’d like to stay up to date.
Glow lamp filled with nitrogen
For our experiment, we used a glow lamp powered by a CCFL inverter, which is actually designed for cold-cathode lamps. The inverter reliably ignites the lamp and ensures a stable discharge along one electrode. In addition to the affordable DIY spectrometer, we also wanted to use materials that were as inexpensive and readily available as possible. The result is an experiment that is easy to set up but still makes sophisticated molecular physics visible.
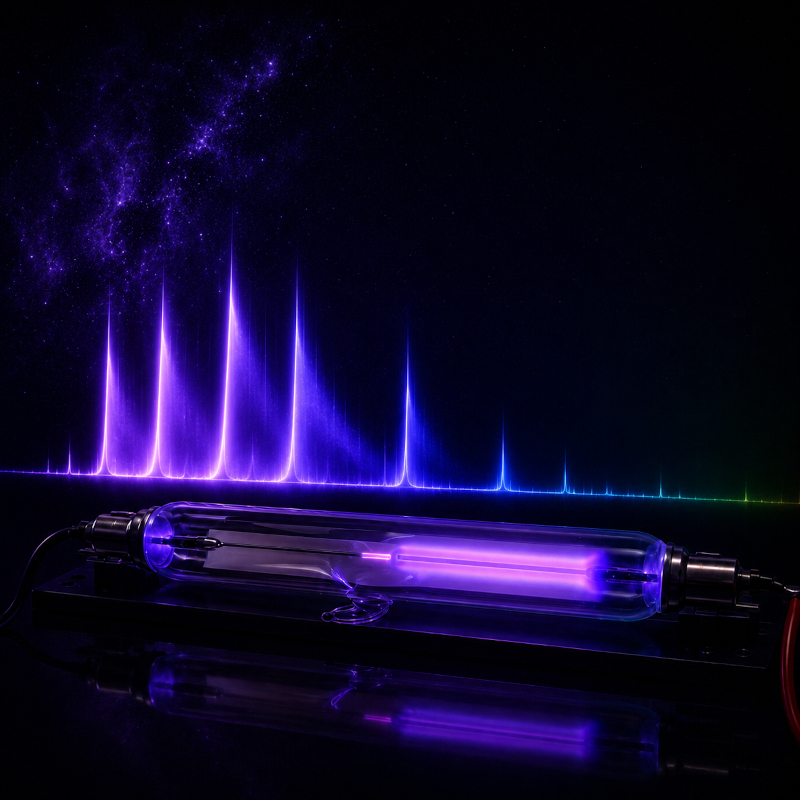
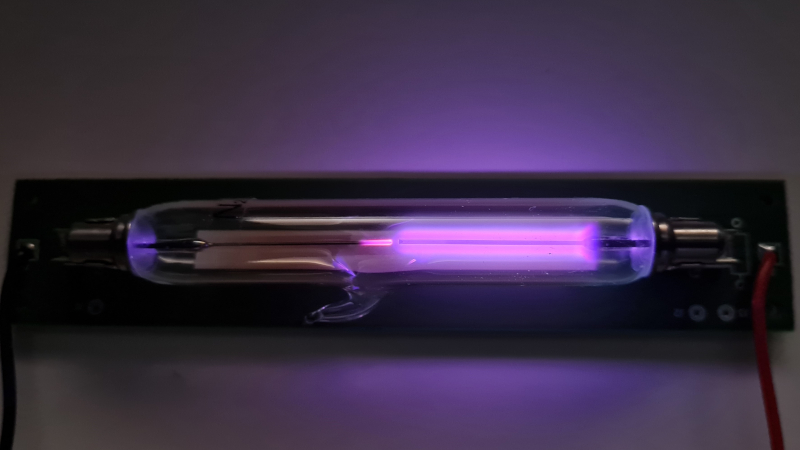
Even to the naked eye, the nitrogen glow lamp reveals its unique character: the discharge emits an intense violet-blue to magenta light. Inside the glass tube, a glowing discharge zone is visible, forming primarily along one of the electrodes.
This phenomenon is characteristic of a glow discharge in a rarefied gas. Electrons are accelerated between the electrodes by the electric field. When they collide with gas molecules, the molecules can be excited or ionized. As they return to lower energy states, the molecules then emit light.

The nitrogen glow lamp was powered here by a 5-V CCFL inverter, which generates a high-frequency, high-voltage output. The discharge is therefore not triggered by a DC voltage, but by an AC voltage in the kHz range.
Nevertheless, the visible discharge does not have to appear completely symmetrical. Real-world inverter outputs, connecting wires, stray capacitance, lamp geometry, and electrode surfaces do not form an ideal, perfectly symmetrical system. As a result, the discharge may appear to form more strongly along one side of the electrode. In the experiment, the asymmetry could be influenced by swapping the connections: the brighter discharge zone shifted accordingly to the other side.
This is not critical for spectroscopic analysis. What matters is that nitrogen molecules in the gas chamber are excited and partially ionized, emitting their characteristic band spectra in the process.
Even though the inverter used is powered by only 5 V, it generates a high AC voltage at its output. The circuit must therefore be operated in an isolated configuration and must not be touched while in operation. For use in schools, practical classes, or workshops, the high-voltage section must be housed in a touch-proof enclosure or operated under direct expert supervision.
Changes to the structure should only be made when the power is off and after any residual charge has been safely discharged.
To get an initial overview, we first recorded a spectrum of the visible spectral range using one of our DIY spectrometers. The 300 lp/mm grating covers a wide wavelength range but resolves individual structures with a coarser spectral resolution.
To record the spectrum, the input of the optical fiber was simply held as close as possible to the glow lamp, and the integration time was adjusted to make good use of the detector's dynamic range without saturating the strongest features.
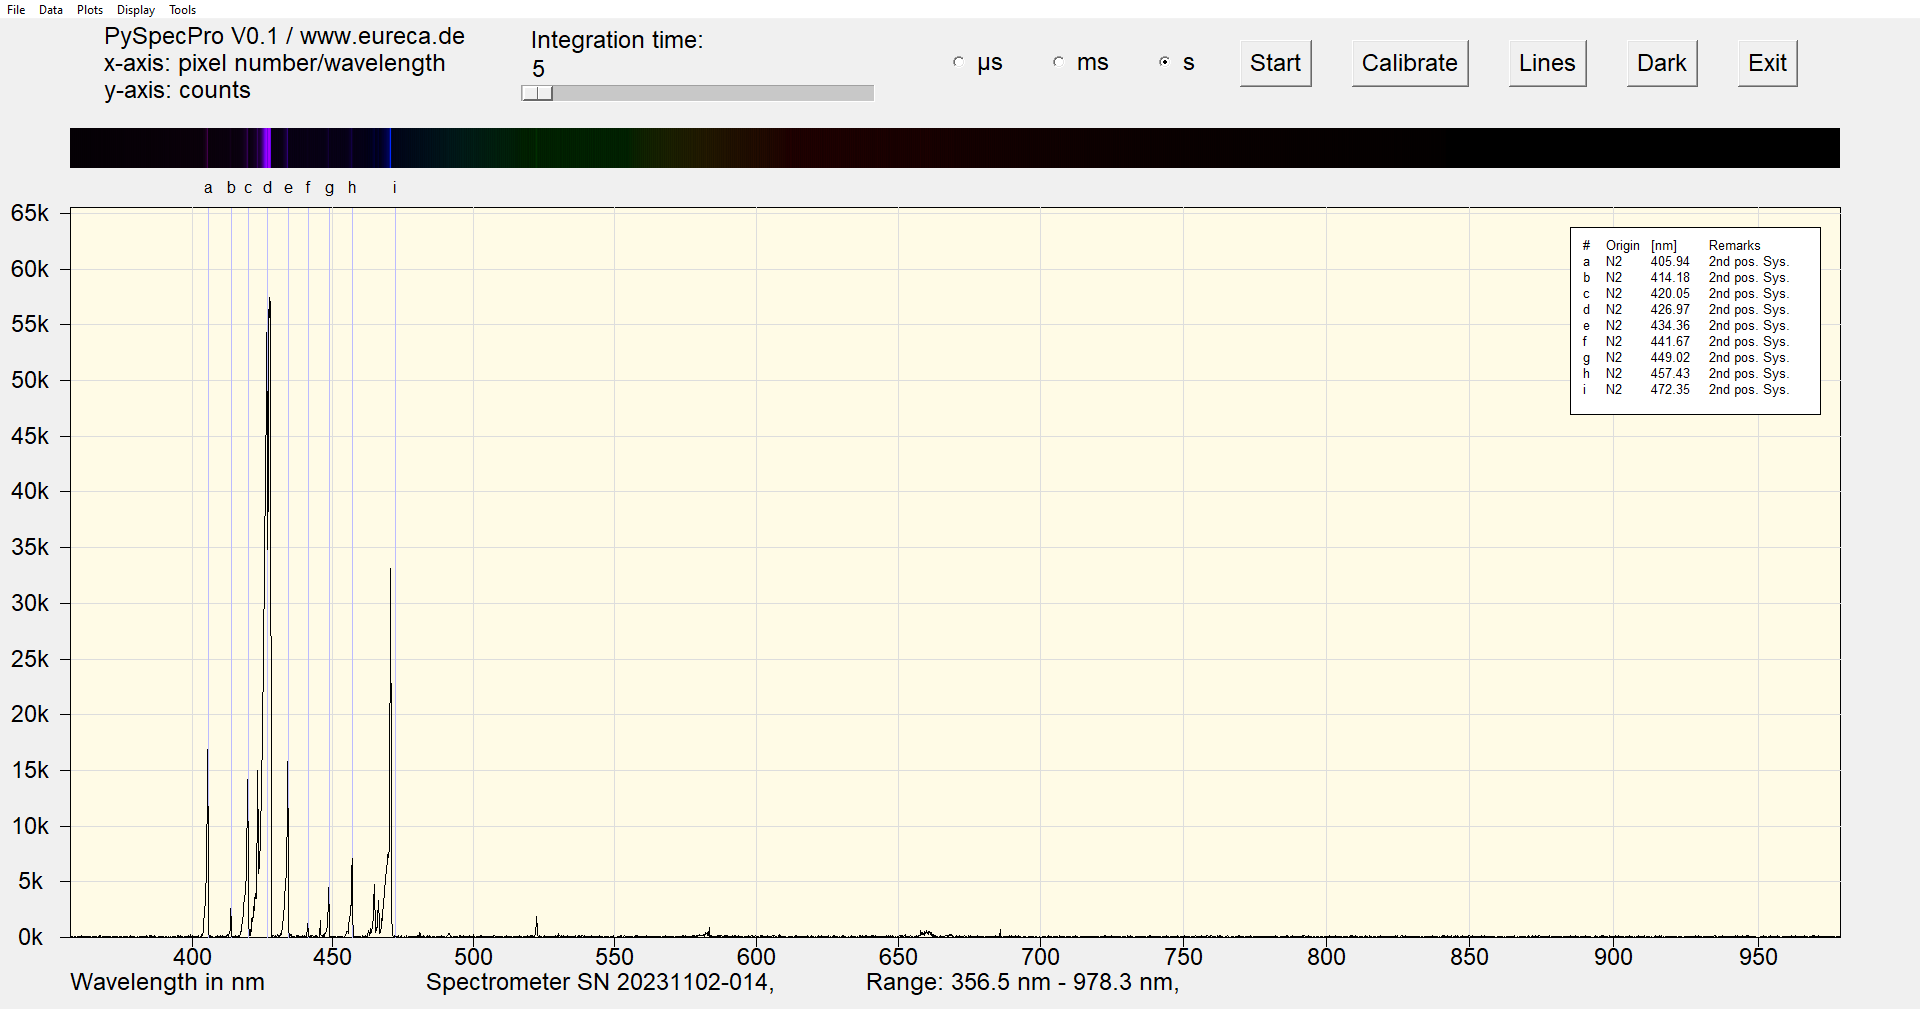
Screenshot of the measurement at low spectral dispersion
The spectral overview directly reveals the reason for the violet glow of the nitrogen glow lamp: the dominant emissions lie almost entirely in the short-wavelength visible region.
Several intense peaks are observed between approximately 375 nm and 470 nm. Particularly notable are the intense signals at around 391 nm and 428 nm, as well as a number of other peaks in the violet-blue region.
Even in the overview image, it is clear that the most intense features do not resemble typical atomic emission lines. Some peaks appear broadened or asymmetrical. This is precisely where the fascinating difference lies: in the case of nitrogen, these features are not simply individual lines, but rather the bandheads of molecular transitions. Many closely spaced rotational and vibrational transitions overlap and appear in the compact spectrometer as distinct peaks, some of which appear line-like.
The spectra shown are raw spectra from the measurement system. The relative intensities are therefore determined not only by the nitrogen emission itself, but also by the spectral sensitivity of the sensor, the transmission of the Toslink optical fiber, the efficiency of the grating, and the optics of the spectrometer. The measurement is very well suited for identifying the bandheads. However, spectral sensitivity correction would still be required for quantitative statements regarding emission intensities or population distributions.
In a single atom, emission lines occur when electrons transition between discrete energy levels. This alone is a strong argument for the quantum nature of matter: only certain energies are allowed, so only certain wavelengths are produced.
But things get even more interesting when it comes to molecules. A molecule doesn’t just have electronic energy levels; it can also vibrate and rotate. For the nitrogen molecule N₂, this means:
An electronic transition is therefore not simply a single transition from state A to state B. It is coupled with many possible vibrational and rotational states. Each of these transitions has a slightly different energy—and thus a slightly different wavelength.
The result is a dense pattern consisting of a large number of individual lines. Higher-resolution spectrometers can partially resolve such rotational structures. With a compact DIY spectrometer, however, they appear as broader, characteristic bands with distinct bandheads. It is precisely these bands and their associated bandheads that are particularly clearly visible in the spectrum.
The 300 lp/mm grating covered a wide spectral range, but with a coarser spectral sampling interval of approximately 0.17 nm/pixel. The 1,200 lp/mm grating disperses the short-wavelength region more strongly across the detector, reducing the sampling interval to approximately 0.04 nm/pixel. As a result, the bandheads in the violet-blue region become much more visible.
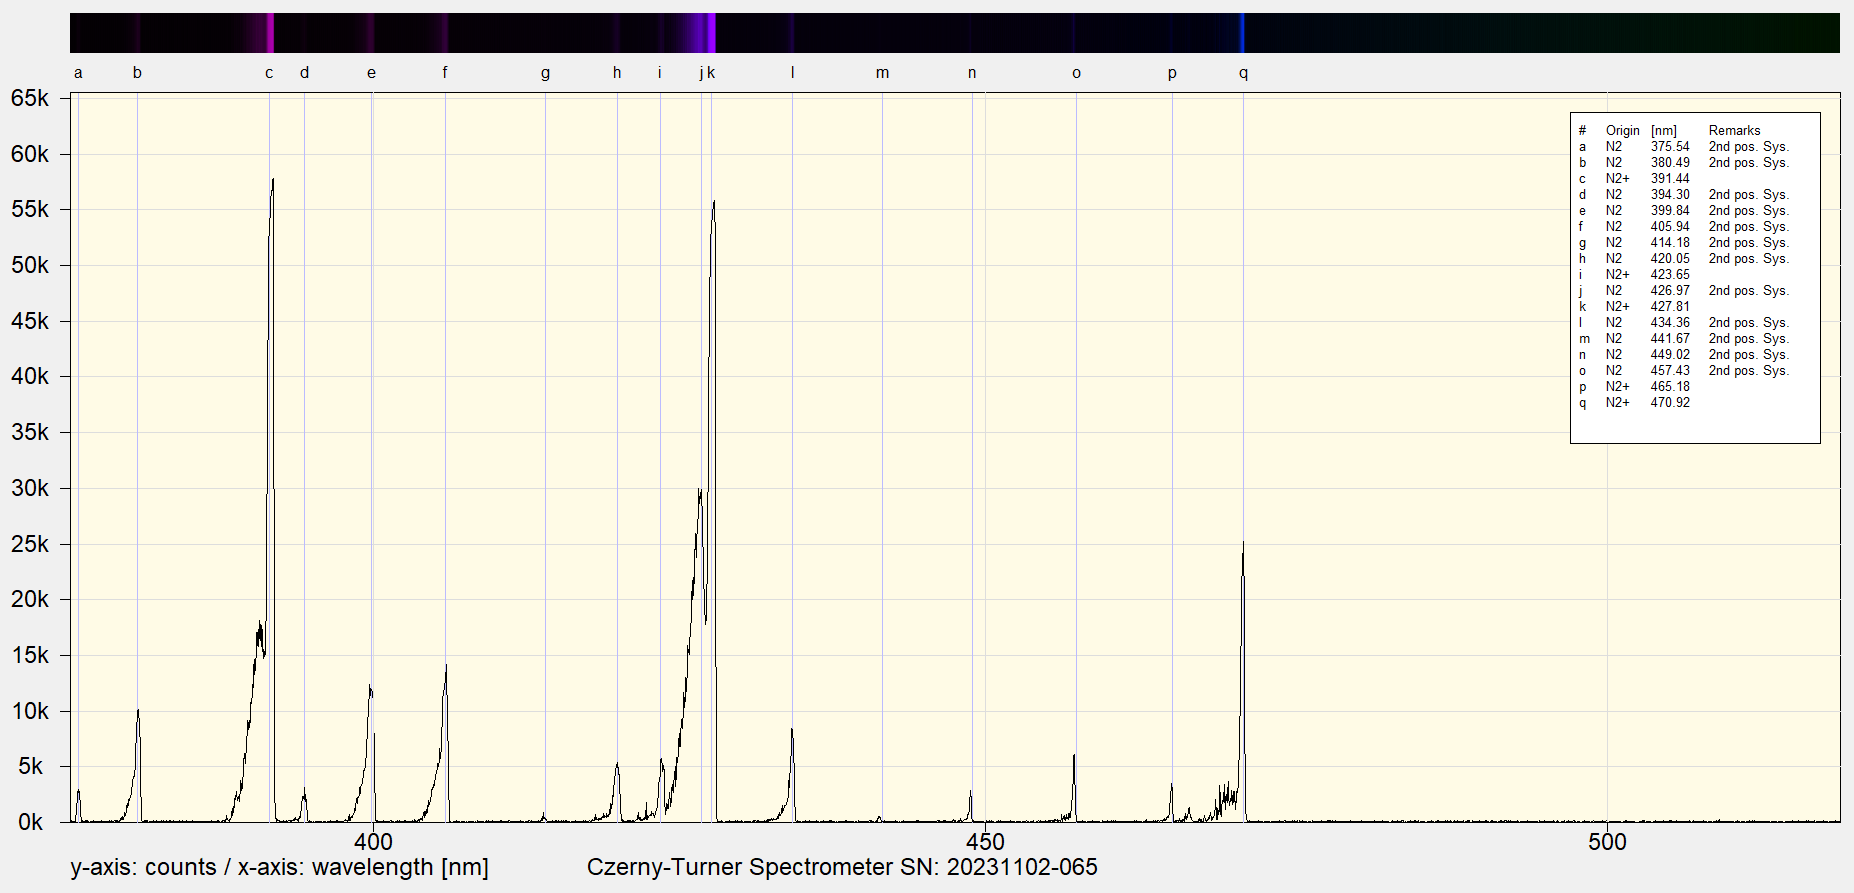
Measurement results at higher spectral dispersion
In the detailed image, the maxima—which were previously only roughly visible—appear much more clearly defined. Many of these structures can be attributed primarily to two well-known band systems: the »Second Positive System« of the neutral nitrogen molecule N₂ and the »First Negative System« of the ionized nitrogen molecule N₂⁺.
The Second Positive System refers to transitions between excited electronic states of the neutral nitrogen molecule. The First Negative System, on the other hand, originates from excited N₂⁺ ions and is therefore a direct indication that not only are neutral molecules excited in the discharge, but molecules are also ionized.
The well-known N₂⁺ bands at approximately 391.4 nm and 427.8 nm are frequently discussed in the context of plasmas, electrical discharges, and atmospheric luminous phenomena. They occur not only in laboratory gas discharges but also in natural phenomena such as the aurora, atmospheric discharges, and lightning. After all, nitrogen is the main component of our atmosphere—and when air is electrically excited, N₂ plays a major role spectroscopically.
For ease of reference, some notable regions of the spectrum are summarized here in simplified form. This information is not intended to serve as a complete list of lines or bands, but rather as an aid in interpreting the measurement.
| Spectral Region | Assignment oder Identification | Meaning |
|---|---|---|
|
approx. 391 nm |
N₂⁺, First Negative System | indication of ionized nitrogen |
|
approx. 400–406 nm |
N₂, Second Positive System | molecular band of neutral nitrogen |
|
approx. 414–428 nm |
N₂ / N₂⁺, overlapping band systems | particularly intense violet-blue region |
|
approx. 434–457 nm |
N₂, Second Positive System | additional bandheads in the blue region |
|
above approx.. 500 nm |
only weak contributions | explains the violet-blue color impression |
A glow lamp does not simply contain cold nitrogen gas. The electrical discharge creates a plasma. Electrons are accelerated in the electric field and collide with nitrogen molecules. In the process, they can excite or ionize the molecules.
As a result, the spectrum includes contributions from:
This is an important pedagogical point: A spectrum does not merely show »what gas is in the lamp«. It also reveals the excitation state of the gas and the processes taking place in the discharge.
A glow lamp, then, is not merely a source of light, but a small, luminous plasma system.
Many molecular bands do not appear symmetrical like a single peak. They often have a steep edge on one side and taper off more gradually on the other. This distinctive structure is called a bandhead.
It forms when many rotational lines crowd together within a narrow wavelength range. The spectrometer is then unable to resolve the individual lines; instead, an intense, sharp-looking region appears.
This is invaluable for teaching: you can immediately see that the spectrum consists not only of »peaks of varying widths«, but that the shape of the peaks themselves contains physical information.
This experiment is an excellent way to illustrate the transition from atomic physics to molecular physics.
In physics, this experiment can be used to demonstrate the limitations of the simple line model. Following the classic examples involving hydrogen, mercury, or sodium, nitrogen can be used to explain why molecules have additional degrees of freedom.
Examples of topics that can be addressed include:
What is particularly valuable here is that the measurement does not simply produce a »textbook-perfect image«, but rather provides real experimental data. You can see noise, variations in intensity, limited resolution, and the need for meaningful interpretation. This is exactly how real-world measurement works.
In chemistry, the spectrum can serve as an introduction to molecular states, chemical bonding, and molecular orbitals. In its ground state, nitrogen is a very stable molecule. However, during an electrical discharge, excited states become accessible, which can be observed optically.
This allows us to discuss questions such as:
The difference between neutral and ionized molecules can also be clearly explained here.
Nitrogen is the main component of Earth's atmosphere. Therefore, N₂ and N₂⁺ emissions are also relevant to atmospheric light phenomena. Examples include the aurora, atmospheric discharges, and lightning.
This allows the experiment to be linked to broader scientific questions:
This connection is particularly strong for students: a small glow lamp on the lab bench leads directly to the aurora borealis, thunderstorms, and the upper atmosphere.
From an instrumentation and data-analysis perspective, the nitrogen glow lamp is also a fascinating example. With an atomic line spectrum, it is often sufficient to identify individual narrow lines and compare them with reference values. With the nitrogen spectrum, however, one must look more closely: Which feature corresponds to an individual peak? Where does a band begin? Where do multiple band systems overlap?
This makes the experiment ideal for addressing typical questions in spectroscopy in a practical way:
The nitrogen glow lamp impressively demonstrates why molecular spectra are more than just »broad lines«. Hidden within the violet-blue glow of the discharge are electronic, vibrational, and rotational transitions of the neutral and ionized nitrogen molecule. With the DIY spectrometer, these structures become directly visible: first as a violet-blue color impression, then as an overview spectrum, and finally as characteristic bandheads in the detailed image obtained with the 1200 lp/mm grating.
This makes the experiment ideal for schools, universities, and laboratory courses. It combines simple materials with real molecular physics—and demonstrates that a small, glowing glass tube can contain a surprisingly large amount of spectroscopy.
 Would you like to replicate the experiment—in your laboratory or teaching environment? Feel free to contact us—we will assist you with planning, setup, calibration, and selecting the right components. Eureca offers advice based on many years of expertise in optoelectronics, optics and spectroscopy—from DIY setups to OEM solutions. Feedback is expressly welcome: Please share your experiences, results, or suggestions for improvement with us.
Follow us—for example, on LinkedIn—to stay up to date on the latest developments!
![]()
![]()
Here you can easily ask a question or inquiry about our products:
Last update: 2026-06-16

EURECA Messtechnik GmbH
Deutz-Kalker Straße 35, D-50679 Köln
![]()
![]() Phone: +49 (0)221 952629-0
Phone: +49 (0)221 952629-0
Fax: +49 (0)221 952629-9
info(at)eureca.de
www.eureca.de


