

 MENU
MENU
Lightning fascinates people. It is loud, bright, dangerously beautiful—and, from a physical standpoint, nothing more than short-lived plasmas in which air particles are ionized and made to glow. The adjacent image shows a cloud-to-cloud lightning strike as an example of this natural phenomenon. This is precisely where the idea for this special student project begins: If lightning emits light, surely it should be possible to spectroscopically analyze that light. And from the emission lines of the plasma, it might even be possible to determine its temperature.
.jpg)
Photo credit: André Karwath aka Aka, »Lightning cloud to cloud (aka).jpg«, via Wikimedia Commons, license: CC BY-SA 2.5. No modifications.
Peter Kubach from the Albert Schweitzer High School in Neckarsulm entered the »Jugend forscht« competition with this research question. The project was supported, among other things, by one of our DIY Czerny-Turner spectrometers. The competition poster describes the entire process: from building a lightning generator based on a Tesla coil, through spectral analysis, to the evaluation of emission lines and comparison with professional measurement data.
And as is often the case with real experiments, the most exciting findings weren't just where things went according to plan.
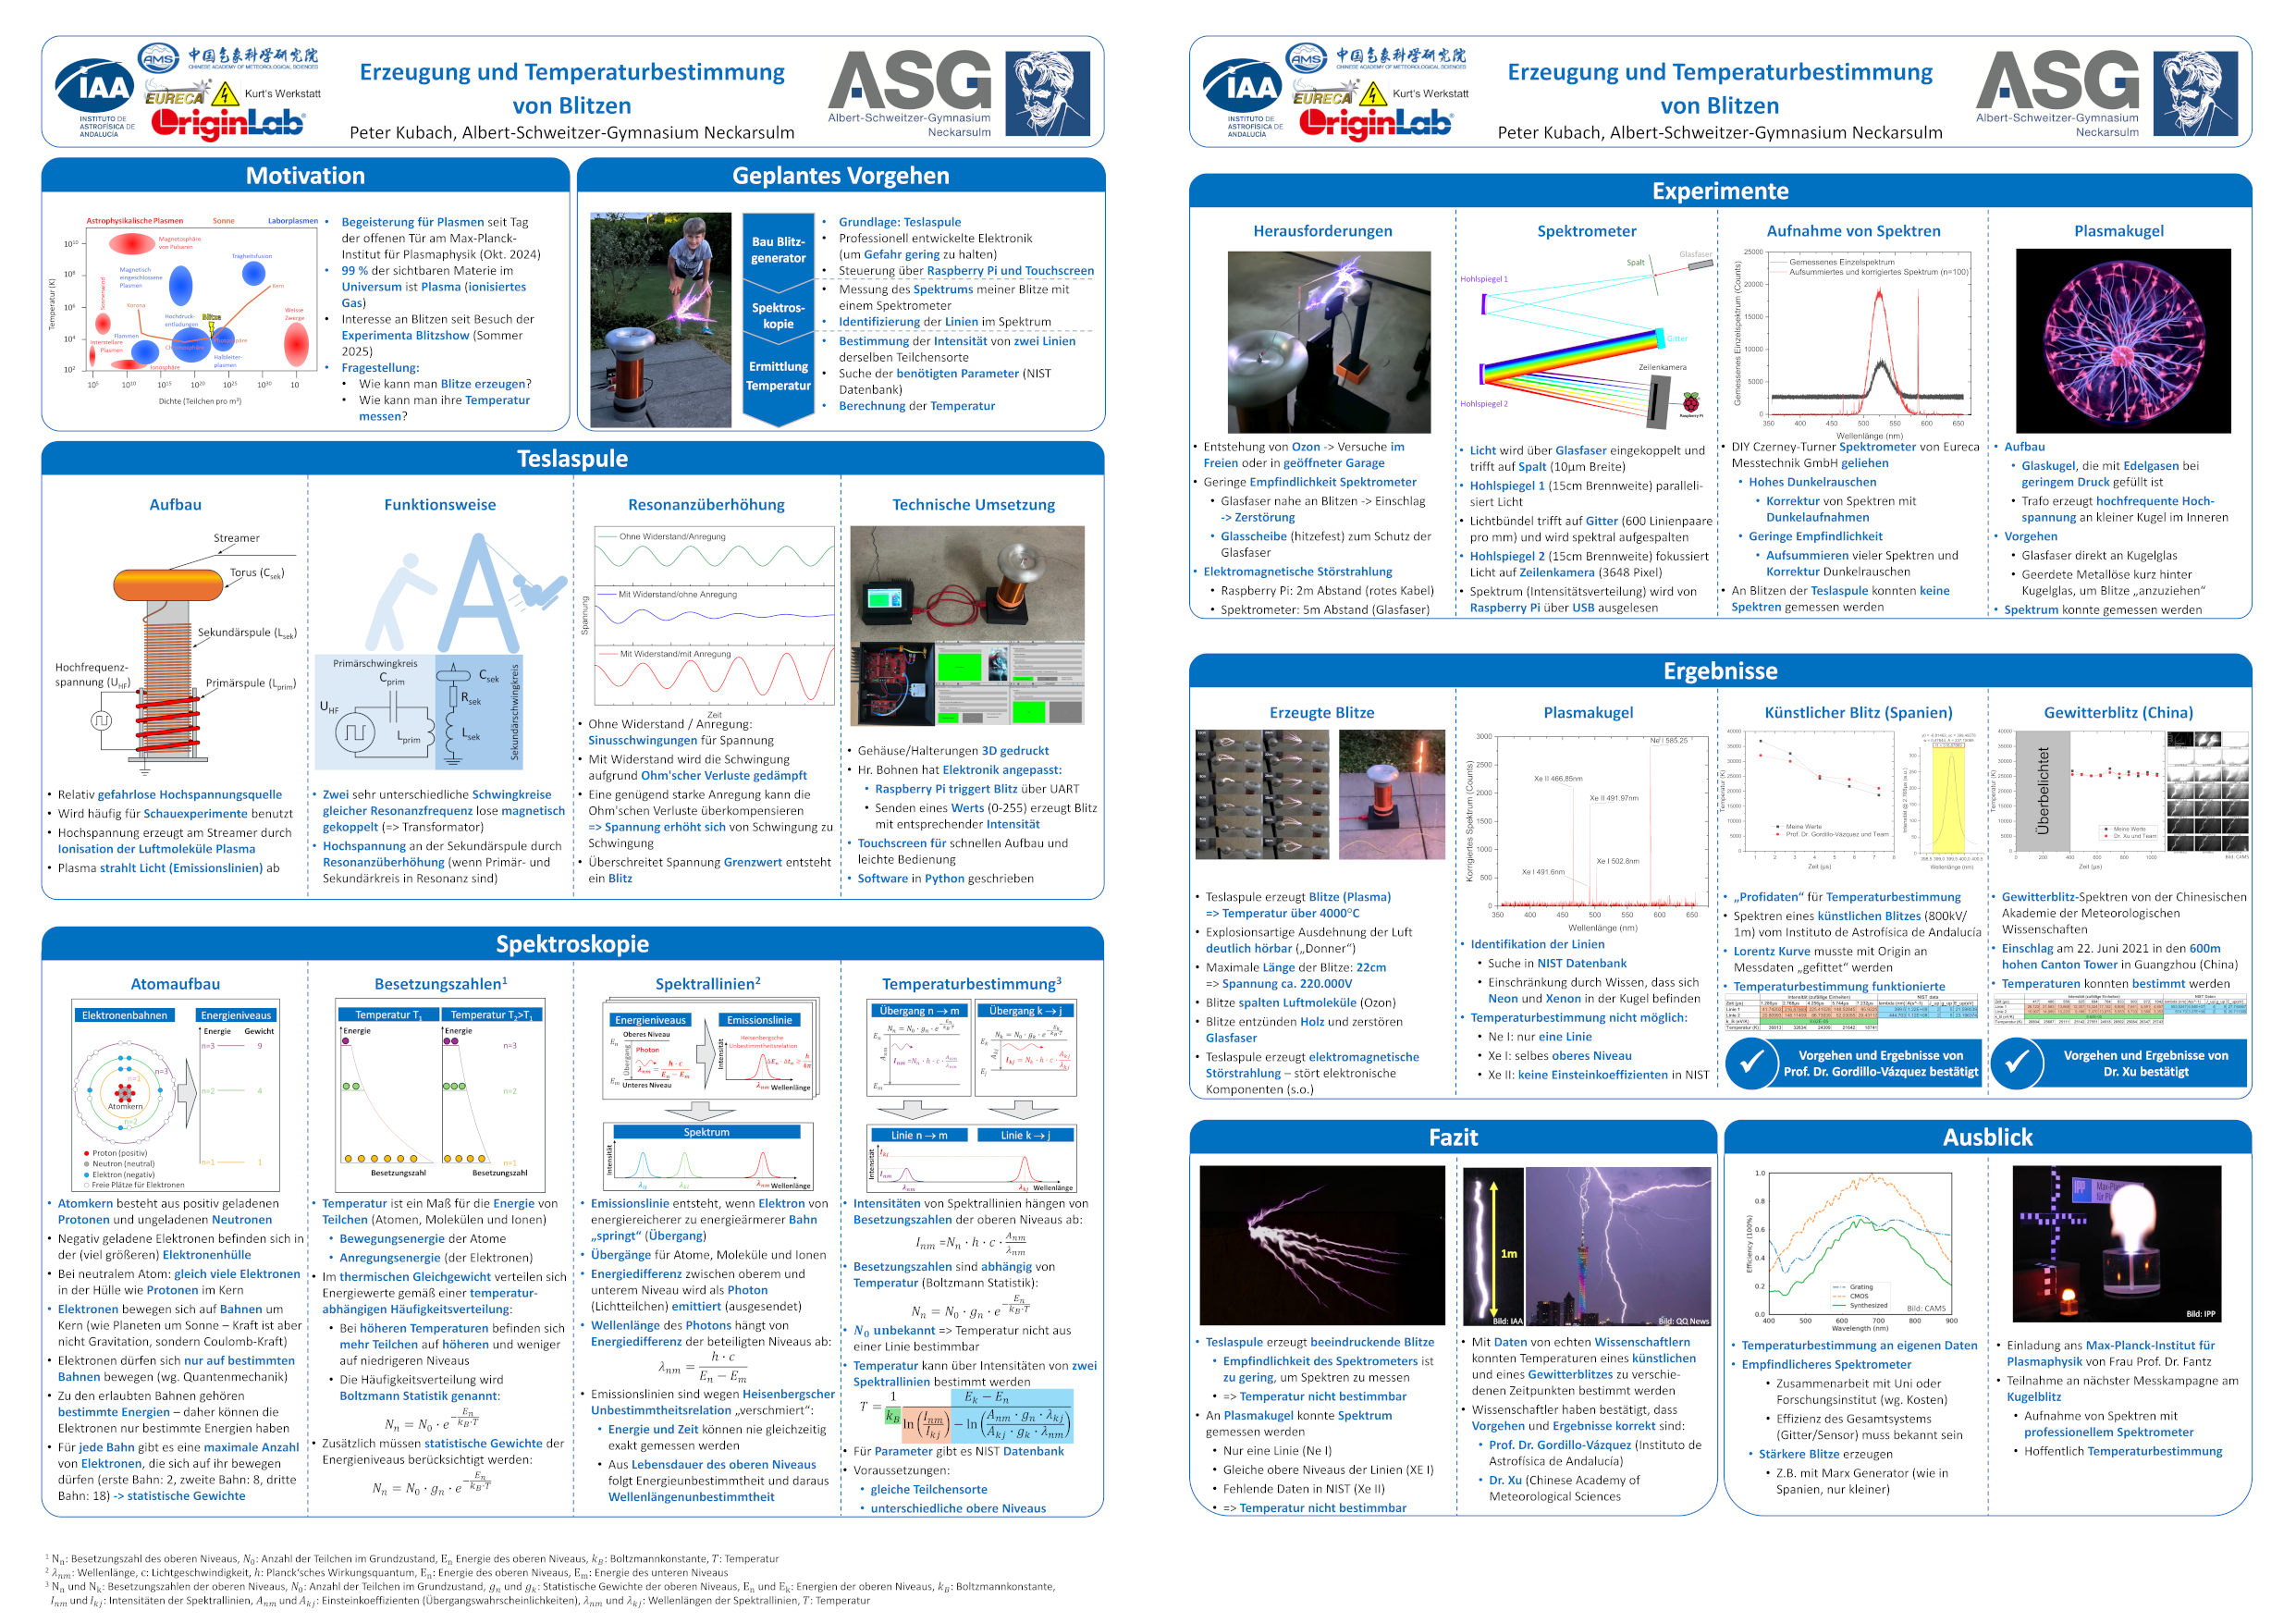
Competition poster for the »Jugend forscht« project »Erzeugung und Temperaturbestimmung von Blitzen« [»Generation and Temperature Measurement of Lightning«] (click on the image to enlarge, PDF here, German only).
The basic physical principle behind the project is elegant: a lightning strike creates a plasma. In this plasma, atoms, molecules, and ions are excited. When electrons subsequently fall back to lower energy levels, light with characteristic wavelengths is emitted. This results in emission lines.
The intensity of these lines depends, among other things, on how strongly certain energy levels are occupied. These occupation numbers, in turn, depend on temperature. By comparing the intensities of two suitable spectral lines of the same particle species, it is possible, in principle, to determine the temperature of the plasma.
However, several conditions must be met for this to happen:
It is precisely these points that turn what seems like a simple idea into a truly challenging spectroscopic experiment.
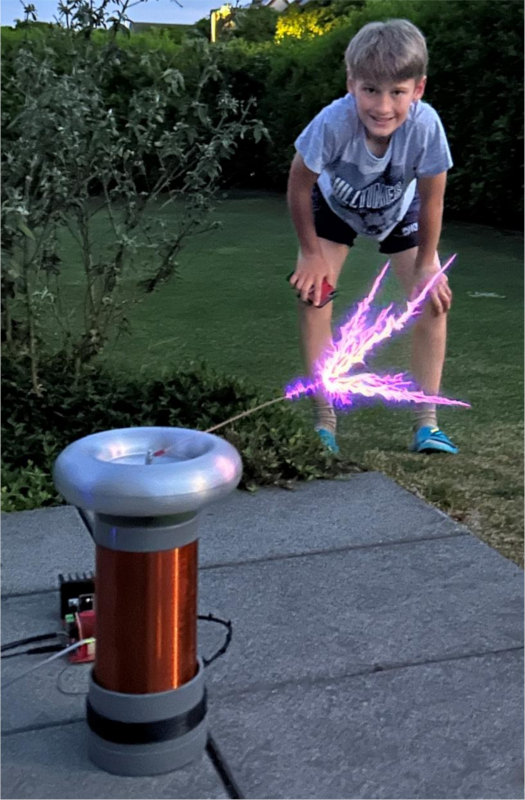
Tesla coil as a compact flash source
A Tesla coil was used as the lightning source. This type of setup generates very high voltages through resonance, resulting in visible streamers and lightning discharges at the secondary coil. The electronics were designed so that the lightning generator could be controlled via a Raspberry Pi. A touchscreen allowed for easy operation, and the software enabled the triggering of different lightning intensities.
The light should be coupled into the DIY spectrometer via an optical fiber. The spectrometer described on the poster operates as a Czerny-Turner setup: The light passes through a 10-µm slit, is collimated by a concave mirror, spectrally dispersed by a grating, and then focused by a second concave mirror onto a line scan camera with 3648 pixels. A grating with 600 line pairs per millimeter was used for the measurements.
That sounds like a pretty straightforward plan. In practice, however, it quickly became clear that lightning isn't exactly the most cooperative lab partner.
The spectra were recorded using one of our DIY spectrometers. Thanks to the libraries we provided, the spectrometer's control system was integrated into the Tesla coil software, allowing the entire experimental setup to be operated via touchscreen.
The Tesla coil produced impressive discharges up to about 22 cm in length. This corresponds to an approximate voltage of around 220,000 V. The discharges were clearly audible, generated ozone, ignited wood, and caused electromagnetic interference in the experimental setup. Due to these interferences, greater distances were required for the Raspberry Pi and the spectrometer.
A second problem arose for the spectroscopy: although the discharges are visually very bright, they are extremely brief. The amount of light that actually entered the narrow slit and passed through the optical fiber into the spectrometer was ultimately too small. Despite dark-frame correction and the averaging of many individual measurements, no usable spectra could be recorded from the flashes of the Tesla coil.
Unfortunately, this meant that it was not possible to determine the original temperature of the self-generated lightning strikes using this spectrometer; although a spectrum could be measured using the plasma ball, the conditions mentioned above were not met. In order to test the principle he had developed for determining temperature, the student consulted experts and obtained measurement data from both artificial and natural lightning strikes. Using this data, he was finally able to determine temperatures. Experts from the Instituto de Astrofísica de Andalucía and the Chinese Academy of Meteorological Sciences confirmed both the results obtained and the procedure for determining temperature.
For a »Jugend forscht« project, it was of course unfortunate at first that we couldn’t analyze our own measurement data. But this is precisely where the limitations of a compact DIY spectrometer become apparent—and where the technical challenges that need to be overcome if we want to move beyond a demonstration toward reliable plasma spectroscopy.

Another particularly interesting observation, however, was one that one might not immediately think of: the UV radiation from powerful lightning discharges can very quickly damage plastic optical fibers. In the case of the Toslink optical fibers used, it was found that the material near the discharge can become cloudy or opaque.
This is an important practical insight. Plastic optical fibers are inexpensive, readily available, and ideal for many experiments. However, they can age or become damaged very quickly when placed near high-energy UV sources or hot plasmas. For future experiments involving strong discharges, one should therefore consider using protective windows, increasing the distance, using quartz glass fibers, or employing alternative coupling geometries.
A quick reminder: Just because an optical fiber transmits light doesn't mean it can handle every type of light that comes its way. A flash is more like a sledgehammer in that regard.
To better understand the lines relevant for temperature determination, high-resolution measurements were also performed on an N₂ glow lamp. By using longer integration times of up to one minute, the required faint lines could be detected and compared with known reference lines.
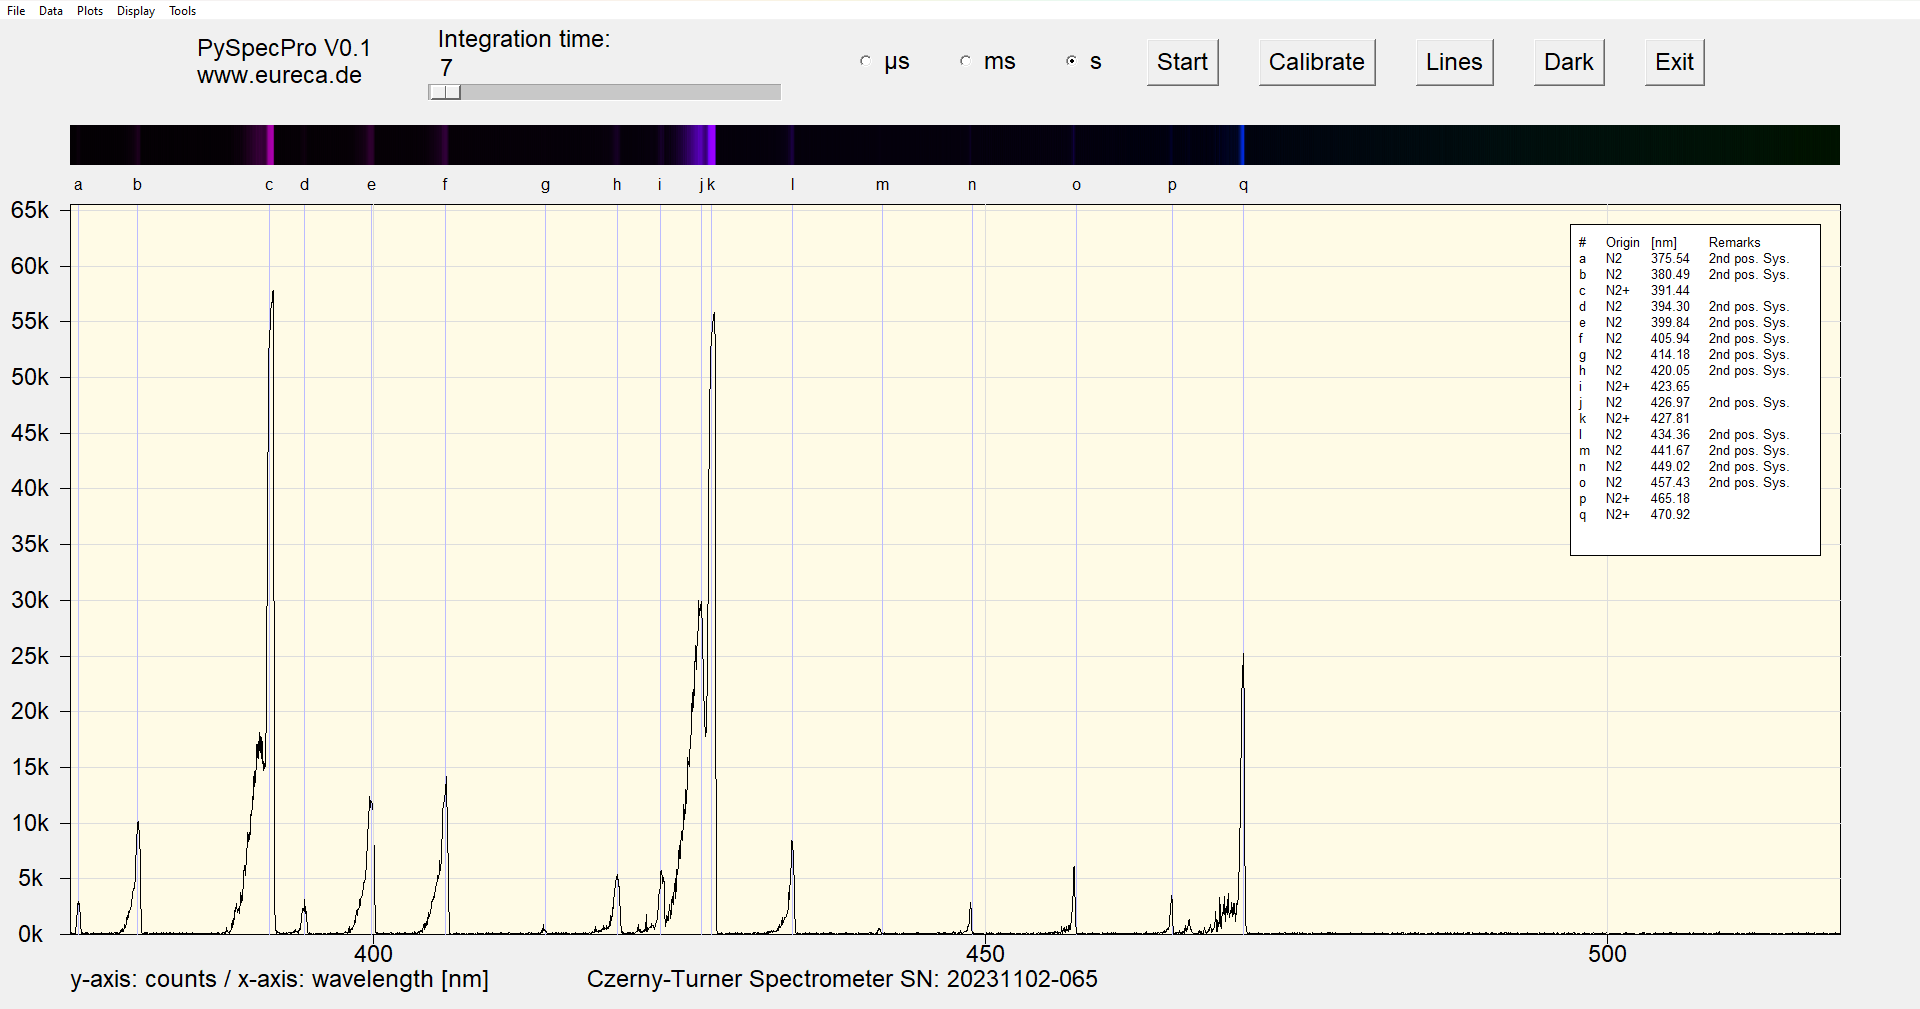
Spectrum of the N2 glow lamp: The interesting lines were identified here.
These measurements were particularly valuable for the project because they demonstrated how important spectral resolution, signal strength, and line identification are for determining temperature. Especially in the case of molecular nitrogen and ionized species, closely spaced lines and band systems can occur. Without sufficient resolution and careful identification, there is a high risk of comparing the wrong lines.
This is a particularly interesting point from an educational perspective: the spectrometer does not simply measure »temperature.« Initially, it measures only intensity as a function of wavelength. It is only through calibration, line identification, databases, and a suitable physical model that this data is converted into temperature information.
This project is a wonderful example of just how far you can go with a compact DIY spectrometer—and where the next stage of development begins.
The lesson here is:
Measuring the temperature of a lightning bolt with a DIY spectrometer? It's a brilliant idea. Putting it into practice is challenging. And that's exactly why this project is so exciting.
The spectrometer used was not sensitive enough to detect the self-generated flashes from the Tesla coil with sufficient precision to determine a temperature. Nevertheless, the project yielded valuable insights into plasma spectroscopy, line identification, optical fiber coupling, UV damage to optical materials, and the limitations of compact spectrometers.
For us, this experiment is therefore not a failed project, but a very honest piece of applied research: A student asks a good question, builds a complex experimental setup, encounters real measurement limits—and in the process learns things that you wouldn't see in any simplified school experiment.
Here you can easily ask a question or inquiry about our products:
Last update: 2026-06-12

EURECA Messtechnik GmbH
Deutz-Kalker Straße 35, D-50679 Köln
![]()
![]() Phone: +49 (0)221 952629-0
Phone: +49 (0)221 952629-0
Fax: +49 (0)221 952629-9
info(at)eureca.de
www.eureca.de


