MENU
MENU
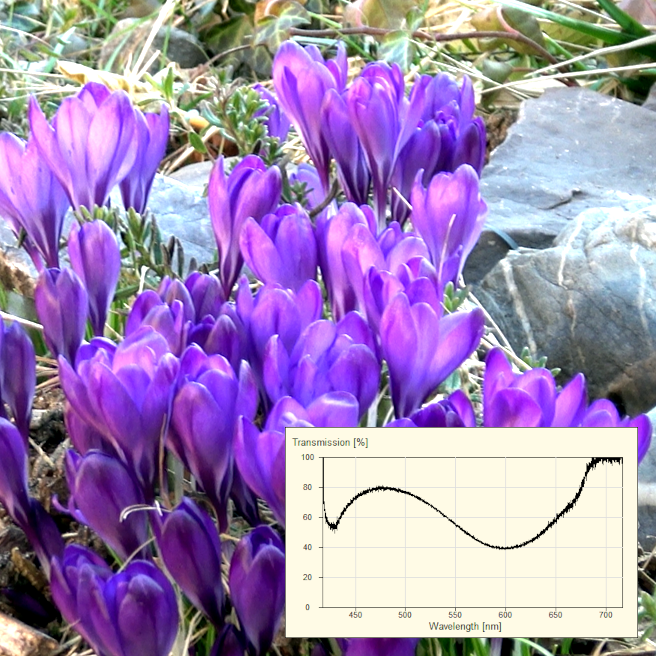
A transmission spectrum describes which wavelengths of light can pass through a material and which are absorbed. When white light hits a sample, some of it is swallowed up (absorbed) and the rest is allowed to pass through (transmitted). We can analyze this transmitted light with a spectrometer and thus obtain the characteristic spectrum of the sample.
The measurement of transmission spectra is a central method in chemistry, physics, biology and materials science. Among other things, it enables

To determine the transmission spectrum of a sample, we measure the transmitted light and set it in relation to a reference measurement. The transmission for a specific wavelength is calculated as the quotient of the measurement signal and the reference signal :
Assuming that the light of a certain wavelength has an intensity of in the reference measurement and an intensity of after passing through the sample, the following results:
This means that the sample transmits 50 % of the light at this wavelength and the remaining 50 % is absorbed or scattered.
This method makes it possible to examine the spectral properties of dyes, filters or biological samples in detail!
Transmission spectroscopy is an essential method for characterizing optical filters. While volume filters have a broad but unspecific filter effect due to their absorption, interference filters enable a more precise selection of wavelengths. Both filter types have their specific advantages depending on the application and can be analyzed with our DIY spectrometer to determine their optical properties.
There is a whole range of exciting experiments involving transmission measurements that are easy to carry out. Examples of these are
These experiments not only help to understand the principle of transmission, but also make science a practical experience! We will gradually carry out these experiments with our DIY spectrometers and publish corresponding application descriptions here. If you are interested, follow us on LinkedIn or Instagram, for example!
![]()
![]()
Here you can easily ask a question or inquiry about our products:
Last update: 2025-03-18

EURECA Messtechnik GmbH
Deutz-Kalker Straße 35, D-50679 Köln
![]()
![]() Phone: +49 (0)221 952629-0
Phone: +49 (0)221 952629-0
Fax: +49 (0)221 952629-9
info(at)eureca.de
www.eureca.de