

 MENU
MENU
To get you started with controlling our line scan cameras, we have put together a series of Python scripts that build on each other and gradually demonstrate new functionalities in the control as well as the visualization and evaluation of the sensor data.
Here we concentrate mainly on applications of line scan cameras in a Czerny-Turner spectrometer, as many exciting applications can be realized in research and teaching. However, the techniques shown are of course also suitable for other applications such as general scanning tasks, edge detection, measurement of interferences and much more.
Python was chosen as the programming language for these examples because it is widely used, can be installed quickly across platforms and offers many interesting functions and modules for the operation of our line scan cameras.
The scripts also demonstrate the functions of the cameras with relatively simple operating parameters that are easy to understand and modify. Despite this, they are already sufficiently powerful to be able to carry out sophisticated measurements. This is why the scripts all have the prefix »Easy« in their names.
For applications that require the full range of functions of our cameras – such as the highest possible line rate or triggering for time-critical control – we refer you to the more detailed documentation of all available functions under C++ on our service page.
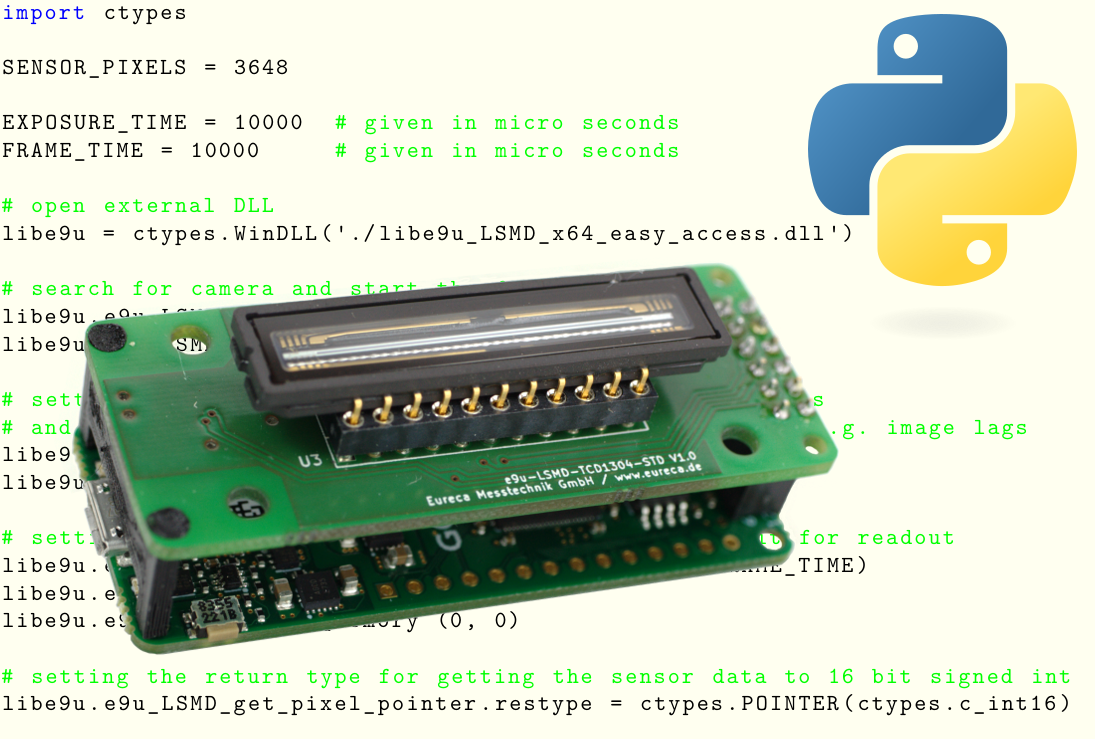
Demonstrates how a connected line scan camera is automatically found and initialized for simple asynchronous control. A single scan is performed and the sensor data is displayed on a terminal using the print function.
In this application note we show how easy it is to use our line scan camera e9u-LSMD-TCD1304-STD using Python. For this we have created a special DLL called libe9u_LSMD_x64_easy_access.dll. It is available free of charge and contains standard camera functions as well as some additional special routines for easy camera operation.
These EasyAccess routines are powerful enough to use the camera in a wide range of applications. In fact, most of our application notes for our line scan cameras are created using these routines.
Visualizes recorded sensor data in a two-dimensional graphical representation as a plot in a separate window. The integration time of the sensor can be adjusted using a slider and switched between milliseconds and microseconds.
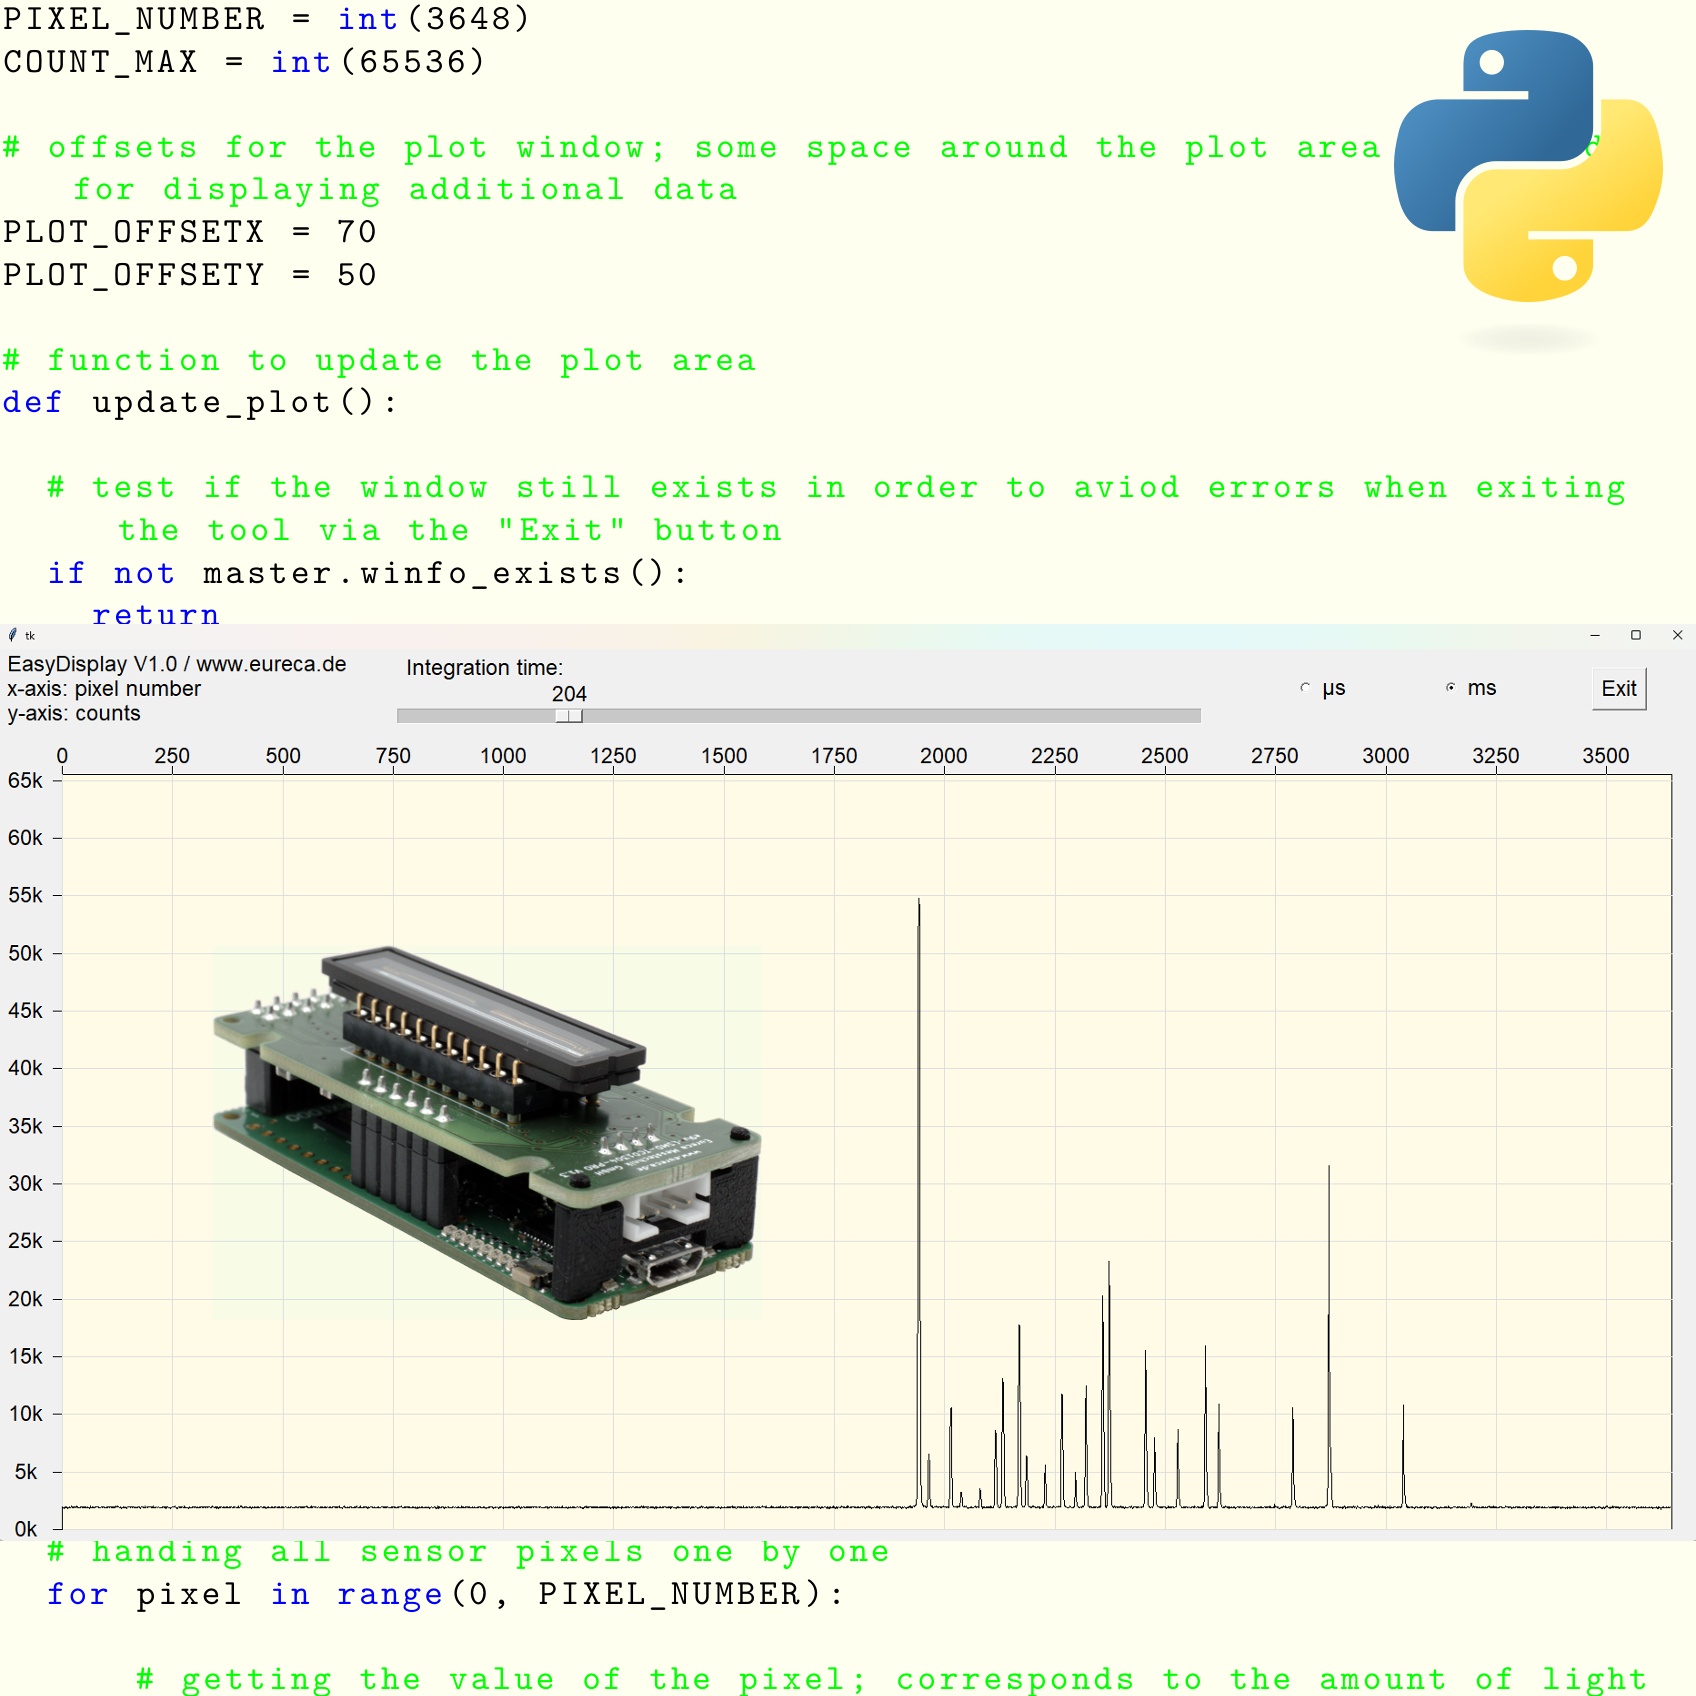
The EasyDisplay program represents a further development of our previous EasyAccess program. It builds on the existing system and integrates an additional simple graphical display of the acquired sensor data from our cameras of type e9u-LSMD-TCD1304-STD. The two-dimensional representation in a plot clearly visualizes the measurement data of the respective pixels.
Especially useful is the additional function, which allows to switch the integration time flexibly between milliseconds and microseconds. This allows the acquisition of measurement data to be precisely adapted to the requirements of the respective application. To ensure convenient and accurate setting of the integration time, a slider has been implemented. This allows the user to adjust the integration time relatively precisely and thus achieve the desired level of control of the sensor.
Enables spectral calibration of the sensor using an inexpensive glow lamp or other spectral light source with known emission lines. Also demonstrates the simple automatic detection of peaks in the sensor signal.
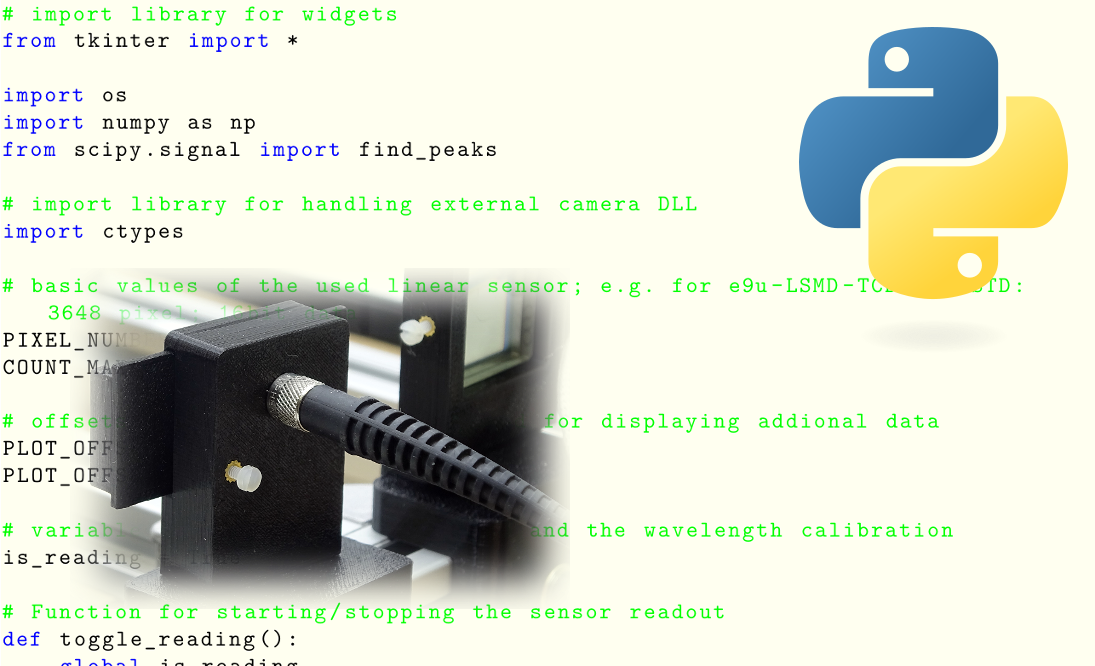
This application note describes the process of the spectral calibration of a spectrometer using the Czerny-Turner Spectrometer CTS-150 as an example. However, this procedure can also be used for other spectrometer types with a similar design. It uses a short Python script called EasyCalibrate, which is an extension of our script EasyDisplay. The script displays the sensor data graphically and uses the manual identification of characteristic peaks in the spectrum of a neon lamp for the calibration process.
Extends EasyCalibrate with more precise wavelength calibration across the entire sensor range using second-order polynomial fit (quadratic regression) with multiple reference lines.
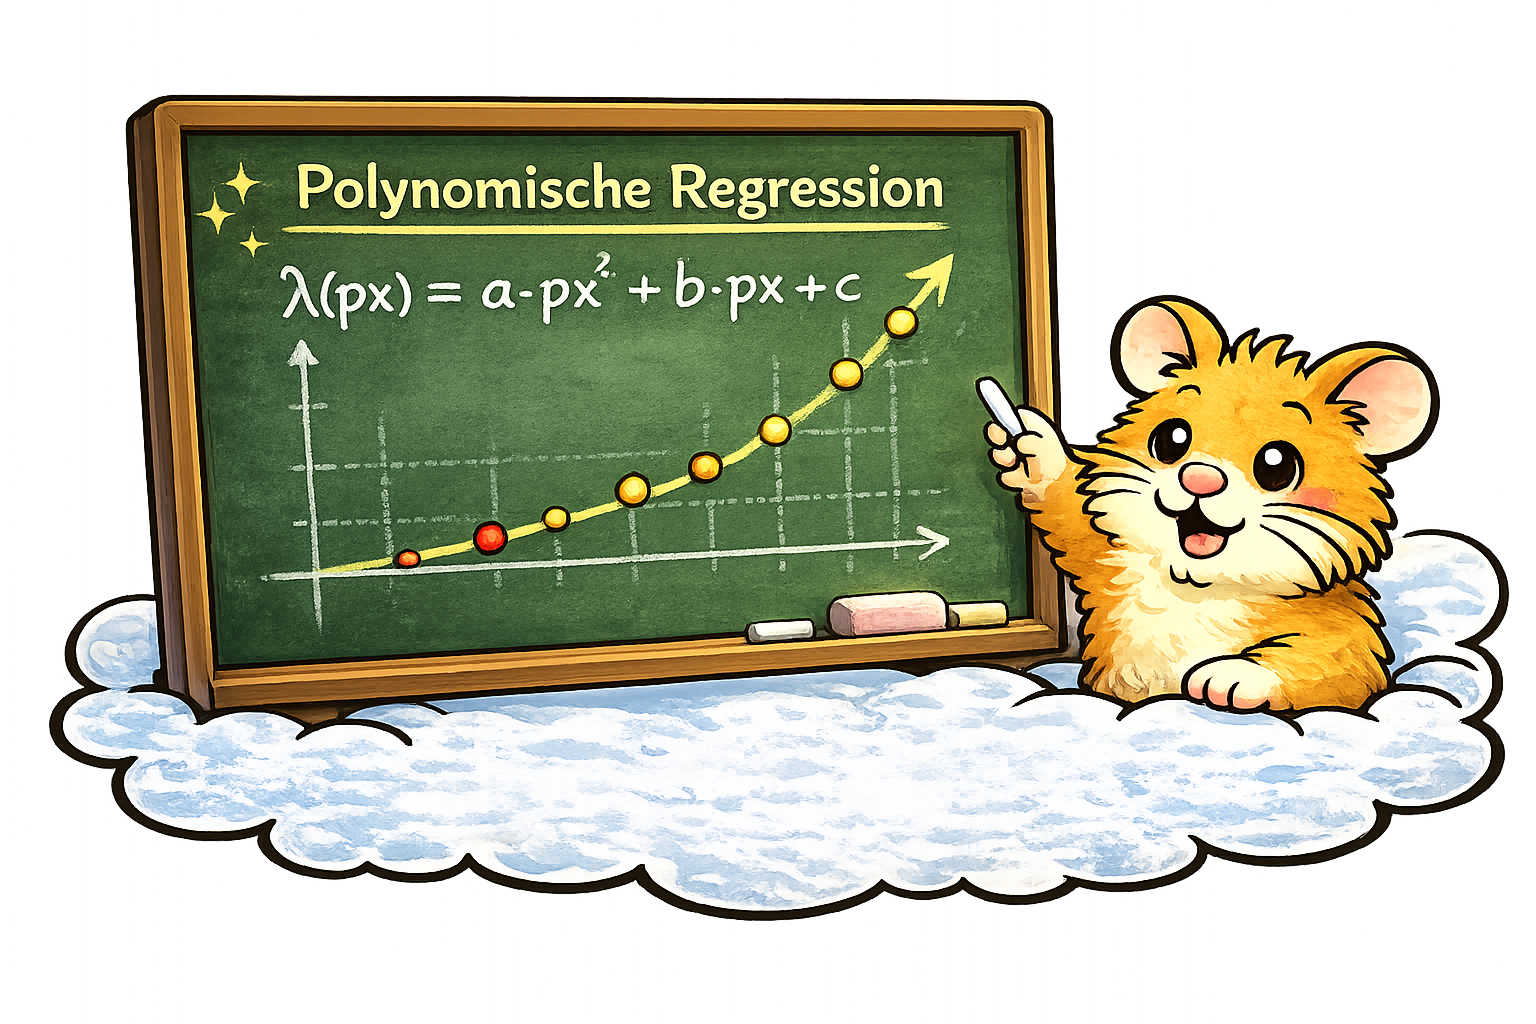
EasyCalibrate Pro is the logical further development of our EasyCalibrate script and is intended for applications where a purely linear pixel ➙ wavelength assignment is no longer sufficient. While EasyCalibrate performs a linear regression with two reference peaks, EasyCalibrate Pro automatically uses a quadratic fit (2nd order) for three or more reference points. This allows the slight non-linearity typical in real spectrometer setups to be mapped much better. As a result, the peak positions can be determined much more accurately across the entire sensor. The script also offers a live display of the sensor data, convenient adjustment of the integration time, start/stop of the camera, and interactive setting of reference peaks (e. g., by right-clicking or pressing the space bar). A red cold cathode lamp (CCFL) is used as an inexpensive reference source in the example shown, as several narrow lines (Hg/Ar) between approx. 435 nm and 810 nm occur relatively evenly distributed in the start phase – ideal for robust multi-point calibration. Note: The additional argon lines are typically only clearly visible in the first ~20 s after switching on.
Demonstrates the visualization of absorption lines in a recorded spectrum using the example of the Fraunhofer lines in the solar spectrum. Of course, the visualization of emission lines is also possible. For the purpose of visualization, wavelengths are also converted into corresponding RGB values for screen or printer output.
Displays the position of spectral lines or bands from an external file in the sensor plot. It also shows how sensor data can be saved.
Shows how a dark signal from the sensor is recorded and saved. This can then be used to correct current scans in order to improve the sensor signal.
Shows how several individual scans of a certain integration time can be added together (stacked) in order to extend the dynamic range of the camera.
Demonstrates the measurement of optical filters such as interference bandpass filters, but also long or short pass filters. The edge positions and maximum transmissions are measured and output.
Here you can easily ask a question or inquiry about our products:
Last update: 2026-05-02

EURECA Messtechnik GmbH
Deutz-Kalker Straße 35, D-50679 Köln
![]()
![]() Phone: +49 (0)221 952629-0
Phone: +49 (0)221 952629-0
Fax: +49 (0)221 952629-9
info(at)eureca.de
www.eureca.de


