

 MENU
MENU
The EasyDisplay program represents a further development of our previous EasyAccess program. It builds on the existing system and integrates an additional simple graphical display of the acquired sensor data from our cameras of type e9u-LSMD-TCD1304-STD. The two-dimensional representation in a plot clearly visualizes the measurement data of the respective pixels.
Especially useful is the additional function, which allows to switch the integration time flexibly between milliseconds and microseconds. This allows the acquisition of measurement data to be precisely adapted to the requirements of the respective application. To ensure convenient and accurate setting of the integration time, a slider has been implemented. This allows the user to adjust the integration time relatively precisely and thus achieve the desired level of control of the sensor.
The program was again implemented in Python and using the external DLL. This combination allows for efficient and user-friendly programming, but can also be implemented with other programming languages. The program is intentionally kept as simple as possible and is intended only to show the functionality of the elements used and thus encourage your own individual further development.
You need a working Python environment for this program. How to install it, if necessary, can be found in the descriptions of our application example for the EasyAccess program.
The program uses the Python module Tkinter for the generation of the graphical elements like buttons or sliders. This may still need to be installed, e. g. from the command line with the following command:
pip install tkinter
Copy the EasyDisplay code shown below into a new Python file with e. g. the name EasyDisplay.py.
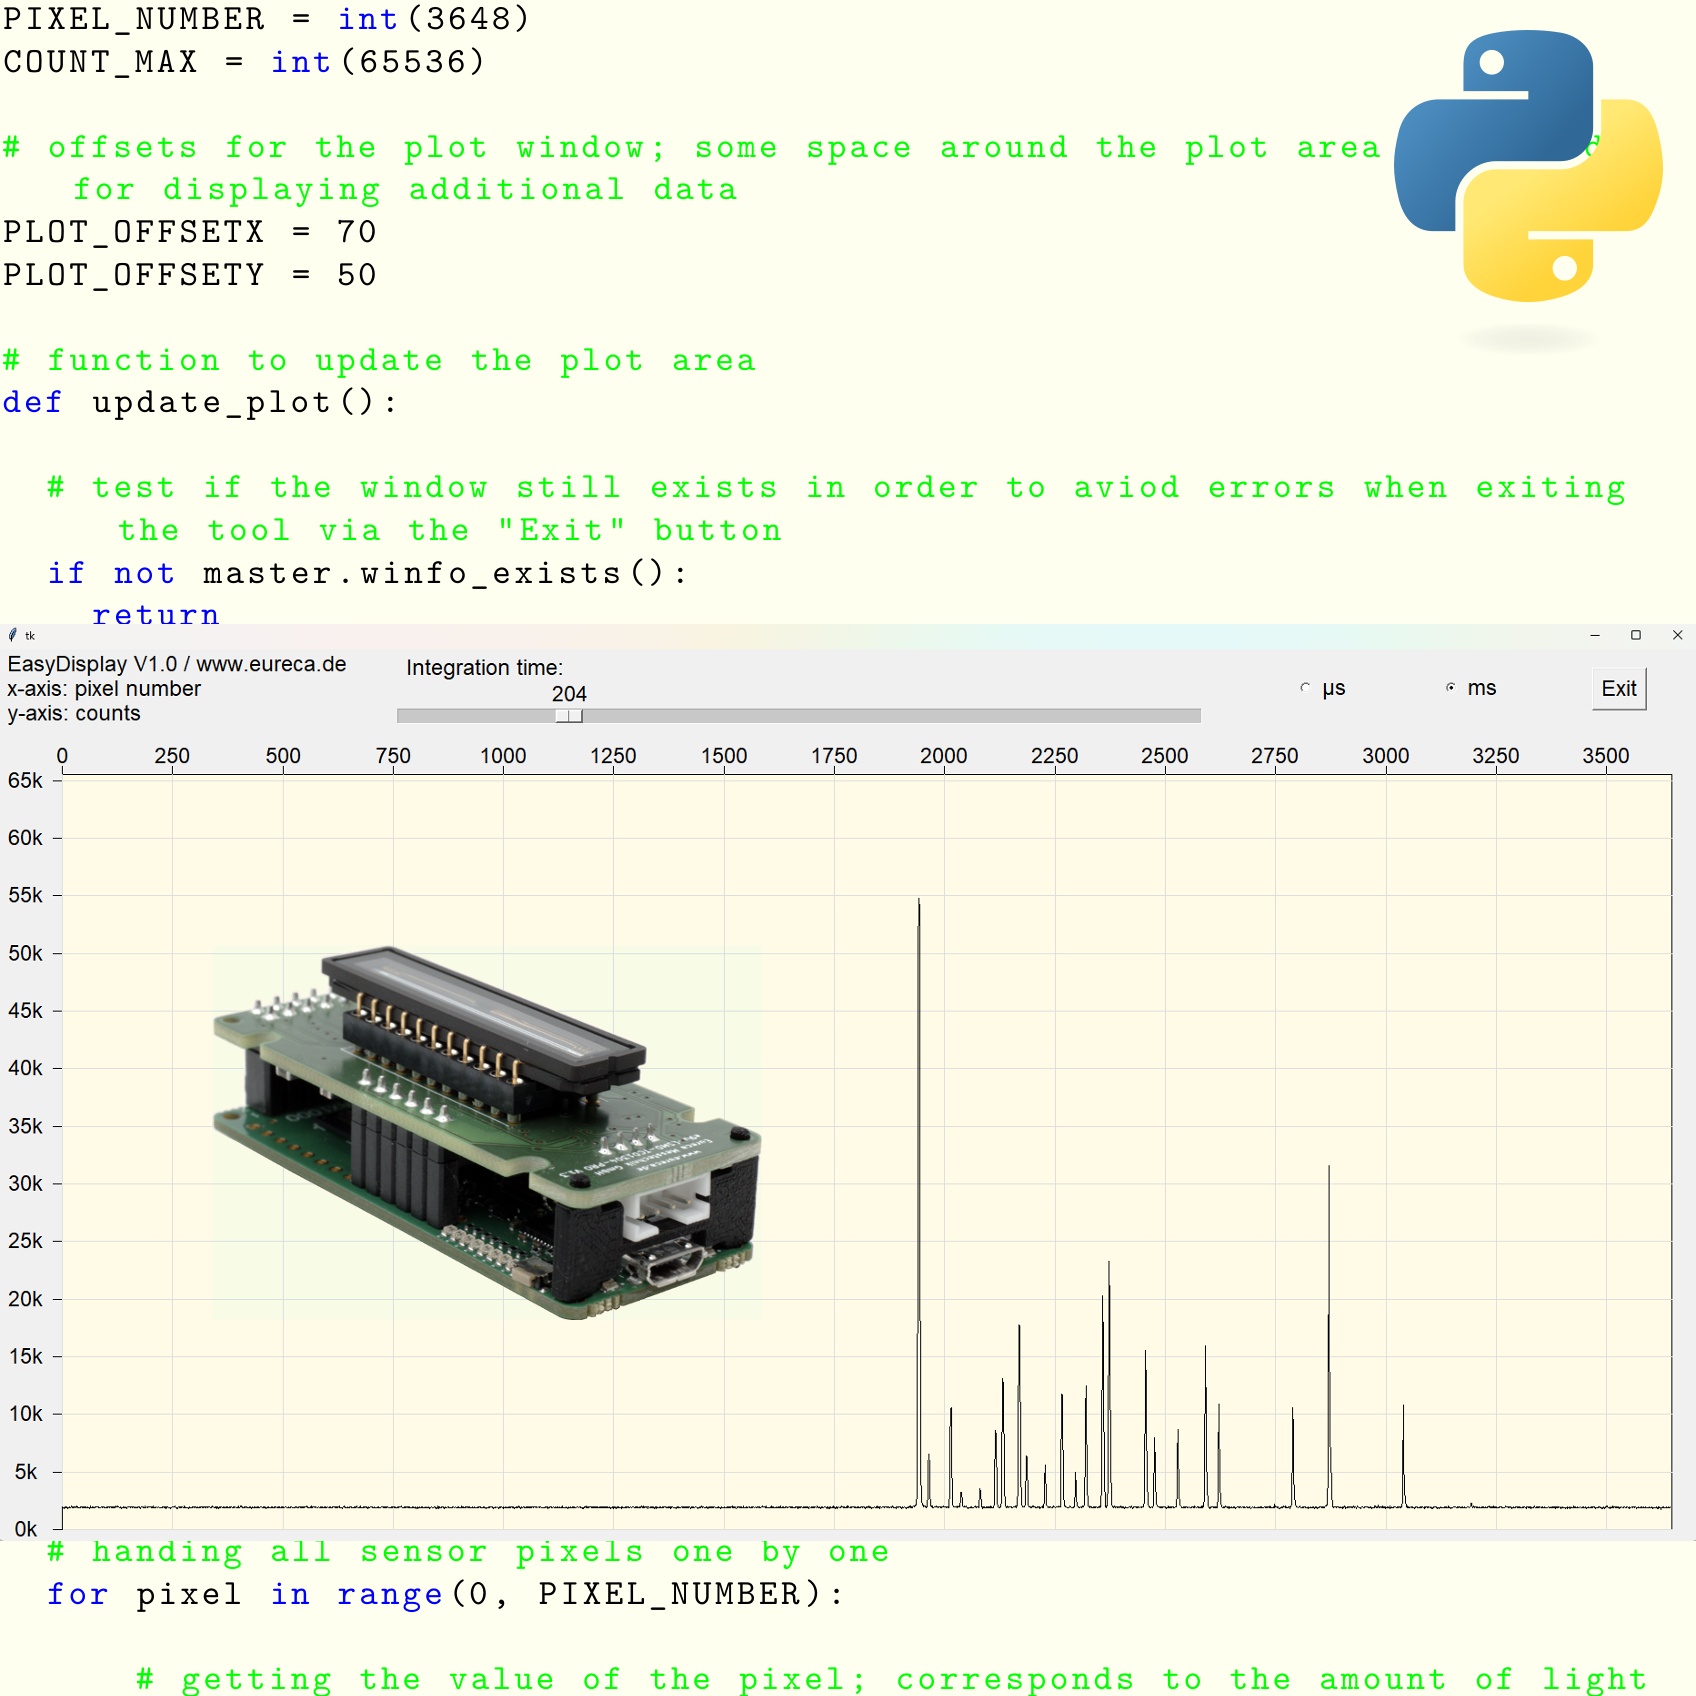
After starting the program, a new window opens, which fills almost the entire screen. A connected camera is automatically searched for, initialized, the readout is started in an endless loop and the obtained measured values are displayed graphically as an x/y plot (pixel measured value/pixel number). As start value for the integration time 10 µs are preset. This can be changed by means of a slider. A radio button can be used to switch whether the value of the slider is interpreted as microseconds or milliseconds.
The integration time for this program is thus limited to a maximum value of 1000 ms, although the camera can also be operated with significantly higher integration times. If required, however, the program can be extended accordingly relatively easily. In addition, the camera can also work with different values for frame_time and exposure_time. To keep the program as simple as possible, the same value of the slider is used for both values and is generally referred to as integration time. For details please refer to the detailed documentation of our cameras. Here, too, there is still a lot of potential for an individual extension of the program.
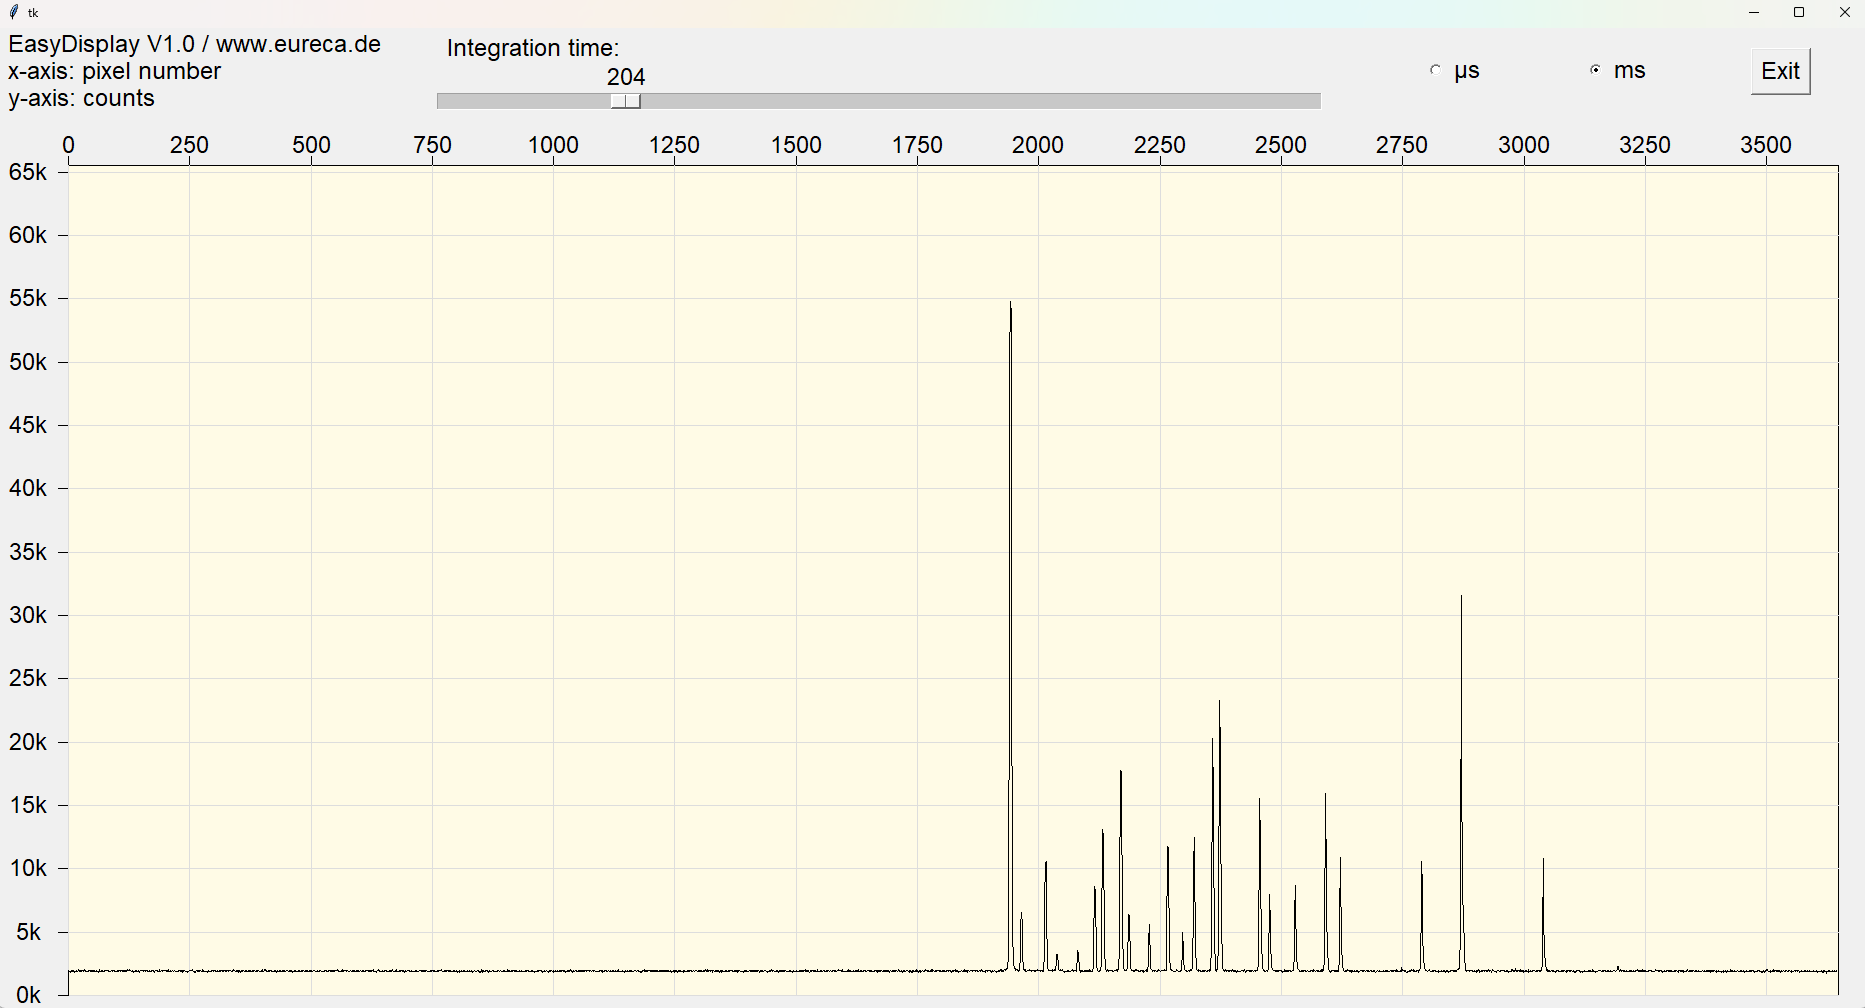
Screenshot of the graphical output for the spectrum of a neon lamp, recorded with our Czerny-Turner spectrometer
# EasyDisplay.py V1.1
#
# This file is part of EURECA's e9u_LSMD_EDU camera software.
#
# EURECA's e9u_LSMD_EDU camera software is free software: you can
# redistribute it and/or modify it under the terms of the GNU Lesser
# General Public License as published by the Free Software Foundation,
# either version 3 of the License, or (at your option) any later version.
#
# EURECA's e9u_LSMD_EDU camera software is distributed in the hope that it
# will be useful, but WITHOUT ANY WARRANTY; without even the implied
# warranty of MERCHANTABILITY or FITNESS FOR A PARTICULAR PURPOSE.
# See the GNU General Public License for more details.
#
# You should have received a copy of the GNU General Public License
# along with this program. If not, see: http://www.gnu.org/licenses/
#
# Python display tool as example code for line scan cameras of the e9u series by EURECA Messtechnik GmbH
# - detects and starts an attached camera in asychrone mode
# - reads out the camera and displays the recorded sensor data
# - the integration time can be adjusted between 1µs and 1000ms
# - extension of our EasyAccess example code
#
# For details please refer to: www.eureca.de

# import library for widgets
from tkinter import *

# import library for handling external camera DLL
import ctypes

# basic values of the used linear sensor; e.g. for e9u-LSMD-TCD1304-STD: 3648 pixel; 16bit data
PIXEL_NUMBER = int(3648)
COUNT_MAX = int(65536)

# offsets for the plot window; some space around the plot area is needed for displaying additional data
PLOT_OFFSETX = 70
PLOT_OFFSETY = 50

# function to update the plot area
def update_plot():

  # test if the window still exists in order to aviod errors when exiting the tool via the "Exit" button
  if not master.winfo_exists():
    return

  # getting the integration time from the slider and using this value for the exposure time as well as for the frame time
  exposure_time = int(slider_exp_time.get()) * faktor.get()
  frame_time = exposure_time

  # reading out the camera; for details refer to the EasyAccess documentation
  libe9u.e9u_LSMD_set_times_us (0, exposure_time, frame_time)
  libe9u.e9u_LSMD_get_next_frame (0)

  # auxiliary variables for displaying the sensor data
  x_old = 0
  y_old = 0

  # deleting the old data points
  plot.delete("data")

  # handing all sensor pixels one by one
  for pixel in range(0, PIXEL_NUMBER):

      # getting the value of the pixel; corresponds to the amount of light by this pixel collected during the integration time
      counts = pointer[pixel]

      # scaling the sensor data to fit into the plot region
      x = int(pixel / PIXEL_NUMBER * plot_width)
      y = int(counts / COUNT_MAX * plot_height)

      # ploting the data point via connecting the current data with the last one
      plot.create_line(x_old + PLOT_OFFSETX,plot_height + PLOT_OFFSETY - y_old,x + PLOT_OFFSETX,plot_height + PLOT_OFFSETY - y, tags="data")

      x_old = x
      y_old = y

  # displaying the made changes in the plot area
  plot.update()

  # calling this funtion again after 1ms delay
  master.after(1, update_plot)


print("EasyCalibration V1.1\nSearching for camera: ")

# open external DLL
libe9u = ctypes.WinDLL('./libe9u_LSMD_x64.dll')

# define argument and return types for the used functions
libe9u.e9u_LSMD_search_for_camera.argtype = ctypes.c_uint
libe9u.e9u_LSMD_search_for_camera.restype = ctypes.c_int

libe9u.e9u_LSMD_start_camera_async.argtype = ctypes.c_uint
libe9u.e9u_LSMD_start_camera_async.restype = ctypes.c_int

libe9u.e9u_LSMD_set_times_us.argtypes = (ctypes.c_uint, ctypes.c_uint, ctypes.c_uint)
libe9u.e9u_LSMD_set_times_us.restype = ctypes.c_int

libe9u.e9u_LSMD_get_next_frame.argtype = ctypes.c_uint
libe9u.e9u_LSMD_get_next_frame.restype = ctypes.c_int

libe9u.e9u_LSMD_get_pixel_pointer.argtypes = (ctypes.c_uint, ctypes.c_uint)
libe9u.e9u_LSMD_get_pixel_pointer.restype = ctypes.POINTER(ctypes.c_uint16)

# Seach for a suitable camera on all USB ports and quit with returning the error code, if no camera is found
i_status = libe9u.e9u_LSMD_search_for_camera(0)
if i_status != 0:
  print("No camera found! Error Code: " + str(i_status))
  exit(1)

print("Starting camera: ", end='')
libe9u.e9u_LSMD_start_camera_async(0)

# getting the pointer to the array containing the sensor data
pointer = libe9u.e9u_LSMD_get_pixel_pointer(0, 0)

# defining the master window for graphical output
master = Tk()

# getting the size of the master window
screen_width = master.winfo_screenwidth()
screen_height = master.winfo_screenheight()

# setting the size of the display window to cover nearly the complete screen
master.geometry(str(screen_width - 50) + "x" + str(screen_height - 100) + "+10+20")

# defining the dimensions for the plot area
plot_width = screen_width - 150
plot_height = screen_height - 250

# defining and packing the control/output widgets
statusline = Frame(master)
statusline.pack(side='top')
plot = Canvas(master)
plot.pack(side ='bottom', fill=BOTH, expand=YES)

# output label for program name and version number
output_peak_width = Label(statusline, text="EasyDisplay V1.1 / www.eureca.de\nx-axis: pixel number\ny-axis: counts", justify=LEFT, font=("Arial Bold", 18))
output_peak_width.pack(side='left', padx=0)

# defining slider for integration time and setting it to 10
faktor = IntVar()
slider_exp_time = Scale(statusline, from_=1, to=1000, length=plot_width/2, orient=HORIZONTAL, label="Integration time:", font=("Arial Bold", 18))
slider_exp_time.pack(side='left', padx=50)
slider_exp_time.set(100)

# defining two radio buttons for switching the integration time between µs and ms
Radiobutton_us = Radiobutton(statusline, text="µs", font=("Arial Bold", 18), variable=faktor, value=1)
Radiobutton_us.pack(side='left', padx=50)
Radiobutton_us.invoke()
Radiobutton_ms = Radiobutton(statusline, text="ms", font=("Arial Bold", 18), variable=faktor, value=1000)
Radiobutton_ms.pack(side='left', padx=50)

# defining the exit button with the respective closing function
def close_window():
    master.destroy()
exit_button = Button(statusline, text="Exit", font=("Arial Bold", 18), command=close_window)
exit_button.pack(side='left', padx=50)

# drawing a rectangular frame for the plot area
Sensor_Plot = plot.create_rectangle(PLOT_OFFSETX, PLOT_OFFSETY, plot_width + PLOT_OFFSETX, plot_height + PLOT_OFFSETY, fill="#fffbe6")

# x-axis marking with pixel numbers
for x in range(15):
  plot.create_line(PLOT_OFFSETX + x*250*plot_width/PIXEL_NUMBER, PLOT_OFFSETY, PLOT_OFFSETX + x*250*plot_width/PIXEL_NUMBER, PLOT_OFFSETY - 10)
  plot.create_text(PLOT_OFFSETX + x*250*plot_width/PIXEL_NUMBER, PLOT_OFFSETY - 20,font=("Arial Bold", 18),text=int(x*250),fill='black')

  plot.create_line(PLOT_OFFSETX + x*250*plot_width/PIXEL_NUMBER, PLOT_OFFSETY, PLOT_OFFSETX + x*250*plot_width/PIXEL_NUMBER, PLOT_OFFSETY + plot_height, fill="#dddddd")

# y-axis marking with count numbers
for y in range(14):
  plot.create_line(PLOT_OFFSETX-10, PLOT_OFFSETY + plot_height - y*5000*plot_height/COUNT_MAX,
                   PLOT_OFFSETX, PLOT_OFFSETY + plot_height - y*5000*plot_height/COUNT_MAX)
  text_output = str(y*5) + "k"
  plot.create_text(PLOT_OFFSETX-40, plot_height + PLOT_OFFSETY - y*5000*plot_height/COUNT_MAX,font=("Arial Bold", 18),text=text_output,fill='black')

  plot.create_line(PLOT_OFFSETX + plot_width, PLOT_OFFSETY + plot_height - y*5000*plot_height/COUNT_MAX,
                   PLOT_OFFSETX, PLOT_OFFSETY + plot_height - y*5000*plot_height/COUNT_MAX, fill="#dddddd")

# starting the first readout of the sensor and displaying the collected data
update_plot()

master.mainloop()
For clarity, the above EasyDisplay code often does not contain additional lines for error handling. However, it is recommended to evaluate the returned value after each call of a DLL routine, for example, and to perform error handling to ensure correct operation of the camera and/or the computer system. An example of this can be found again in our description of the EasyAccess program.
You will also find this information handy for printing in this PDF.
Here you can easily ask a question or inquiry about our products:
Last update: 2025-12-09

EURECA Messtechnik GmbH
Deutz-Kalker Straße 35, D-50679 Köln
![]()
![]() Phone: +49 (0)221 952629-0
Phone: +49 (0)221 952629-0
Fax: +49 (0)221 952629-9
info(at)eureca.de
www.eureca.de


