

 MENU
MENU
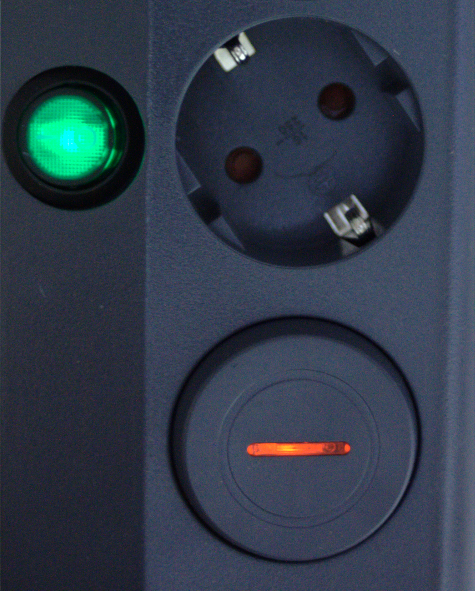
Neon lamps are still used in many electronic devices today as signal lamps to indicate the operating status, although these are gradually being replaced by light-emitting diodes (LEDs). These neon lamps are very inexpensive to purchase and operate and are well suited for simple spectroscopic measurements.
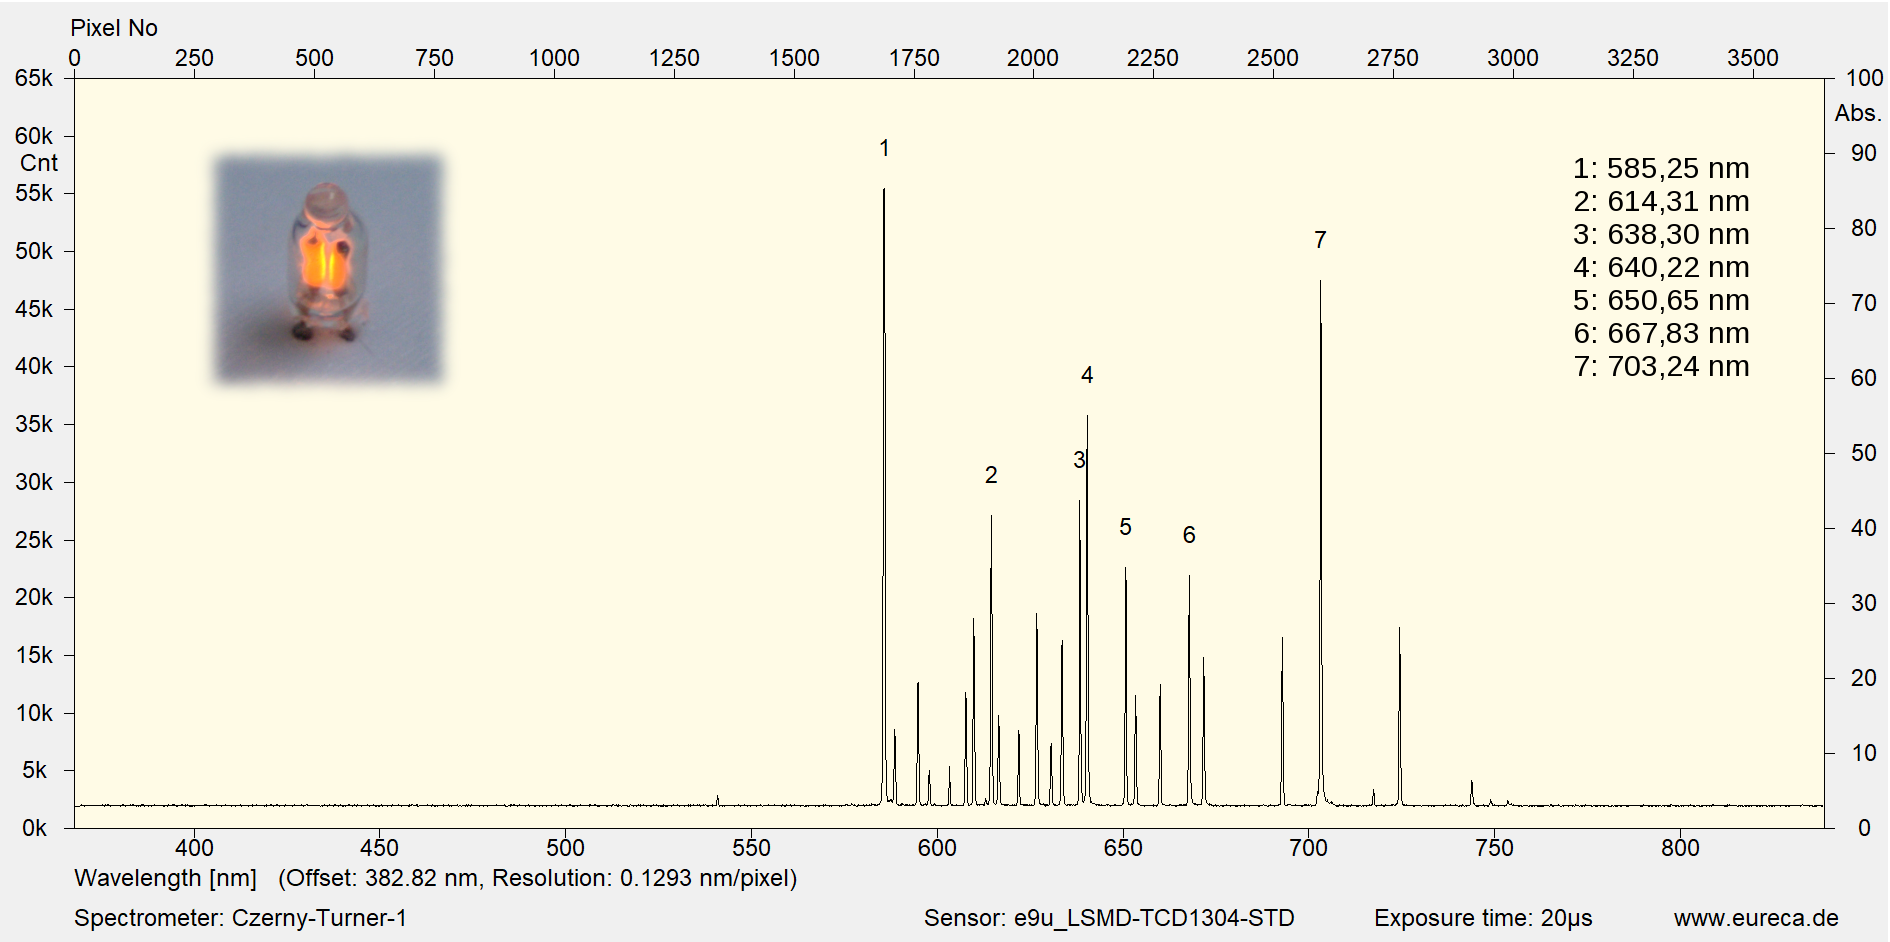
The measurements shown here were recorded with the spectrometer presented in our »Czerny-Turner spectrometer application example«. The sensor TCD1304DG installed in the used line scan camera e9u-LSMD-TCD1304-STD is very light-sensitive due to its rectangular pixels, so that spectroscopic measurements can be carried out for example in teaching very easily even with the low light output of the neon lamps.
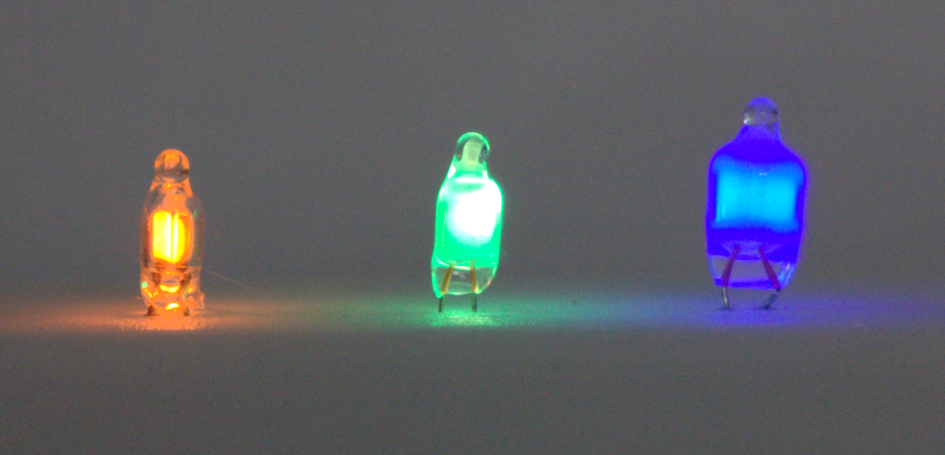
Colored neon lamps
The glass envelope of a neon lamp is filled with a low-pressure gas in which, when a voltage of about 100 volts is applied, a glow discharge occurs between the two cold electrodes. The color of the emitted light depends on the gas. The noble gas neon, which gives the color orange-red, is often used in indicator lights. However, other colors can also be achieved by using other filling gases, for example white with krypton and blue-green with argon. Another way to generate blue-white light, for example, is to use fluorescent phosphors that are excited by UV emissions.
A battery-powered inverter (voltage >100 V, notice safety instructions!) with a unit price of less than 10 € was used to operate the neon lamps. A wide variety of neon lamp variants were tested, all of which can be obtained from various electronics suppliers for less than 1 € each. Depending on the supplier and type, there was a wide range of different spectrums, of which we present three variants here as examples.
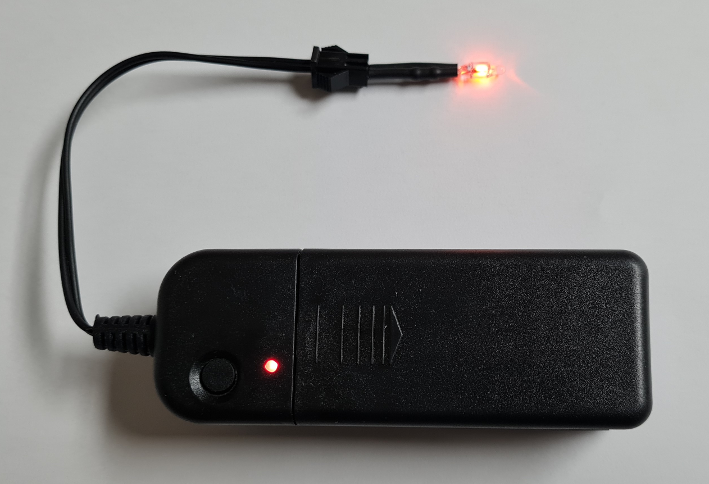
Inverter with neon lamp
The light guide input of the spectrometer was simply held by hand close to the neon lamp, which demonstrates well how easy spectroscopic measurements are with the help of light guides and sufficiently sensitive spectrometers.
As with all of our application examples, you will receive detailed instructions and component lists on request. When replicating, please notice the safety instructions for the inverter, since the operating voltage of the neon lamps is no longer in the safe extra-low voltage range!
The recorded spectrum of a neon lamp filled with pure neon shows the familiar emission lines of neon. Such lamps can even be used for the quick calibration of spectrometers.
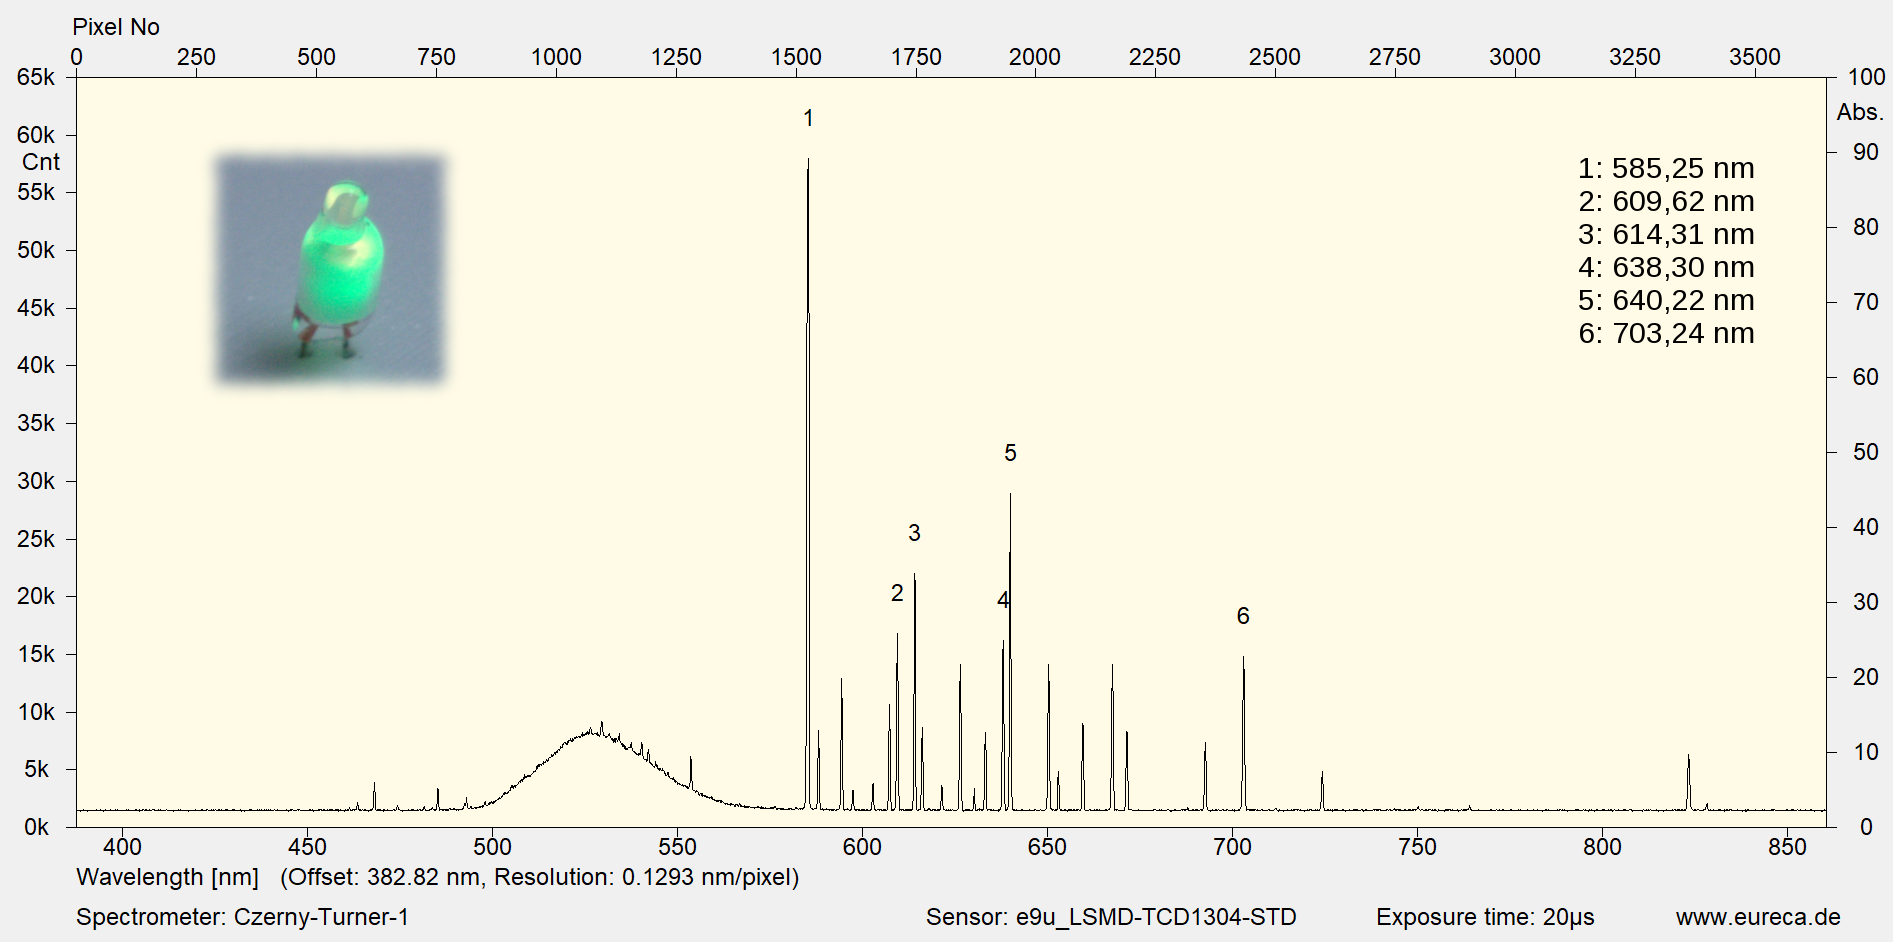
In addition to the well-known emission lines of neon, the recorded spectrum of a green neon lamp also shows a broadband emission range between 500 nm and 550 nm of a fluorescent material.
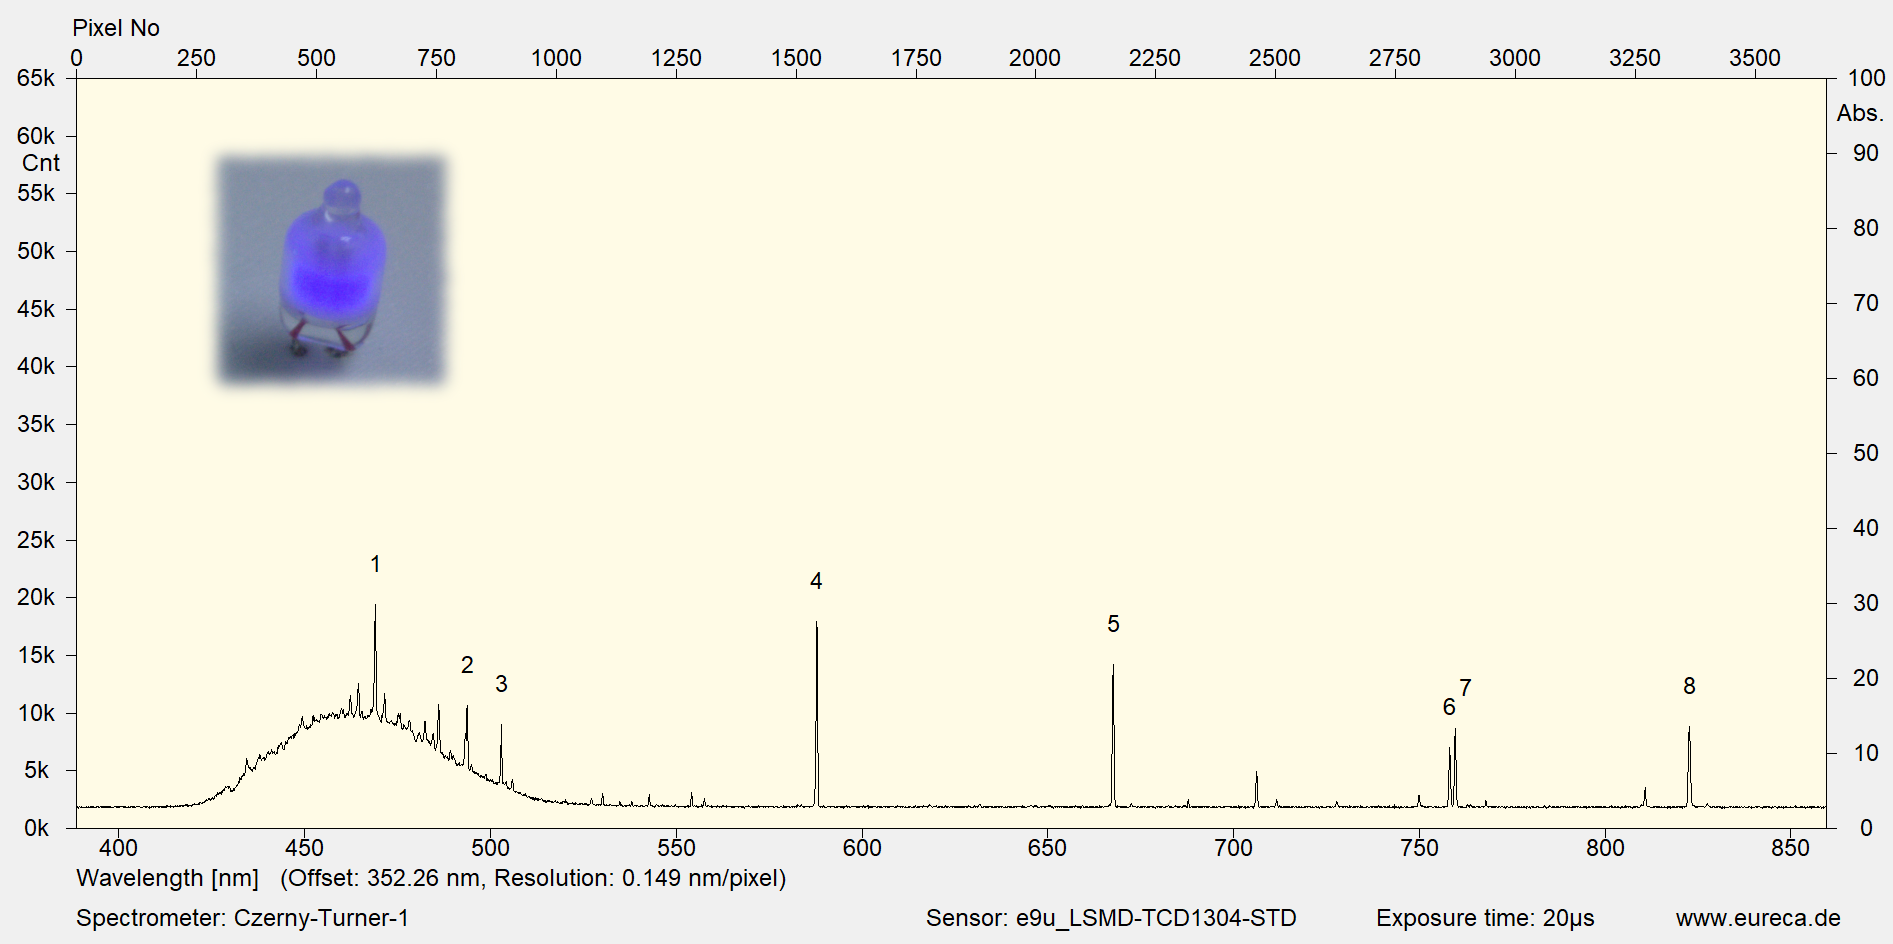
The recorded spectrum of the blue neon lamp shows, in addition to emission lines of noble gases and probably mercury, a broadband emission in the range around 465 nm. Neon lamps of this type use fluorescent materials to generate the blue light. Identifying such unknown spectral lines can be challenging (see didactics).
Spectroscopy with neon lamps offers a wide range of possibilities for carrying out experiments in teaching. Examples are:
In the Czerny-Turner spectrometer, the dependency of the wavelength to the pixel position is linear in a first approximation if the components are suitably positioned. However, if greater accuracy is desired, higher-order polynomials can also be added for a better calibration.
The neon spectrum shows known emission peaks that are easy to identify and on which calibration methods can be worked out.
Narrow emission lines, which can be assigned to specific elements, are found not only in the spectrum of neon lamps, but also in the spectra of other light sources such as fluorescent tubes or energy-saving lamps. The identification and assignment of such lines is sometimes like a detective game and strengthens the understanding of the physical background of the photon emission of the respective light source. A very extensive source for wavelengths of emission lines is, for example, the Atomic Spectra Database des National Institute of Standards and Technology (NIST) in the USA.
You will also find this information handy for printing in this PDF.
Here you can easily ask a question or inquiry about our products:
Last update: 2023-01-02

EURECA Messtechnik GmbH
Deutz-Kalker Straße 35, D-50679 Köln
![]()
![]() Phone: +49 (0)221 952629-0
Phone: +49 (0)221 952629-0
Fax: +49 (0)221 952629-9
info(at)eureca.de
www.eureca.de


