

 MENU
MENU
Depending on the planned application, our DIY spectrometers can be constructed with gratings that have different numbers of lines per millimeter. This then leads to different values in terms of linear dispersion (spectral resolution).
The spectral resolution of a spectrometer depends on the number of line pairs per millimeter of the grating. The general relationship can be approximated by the following formula:
Δλ ≈ (d / f) * p
With a higher number of lines per millimeter, the linear dispersion decreases, which means that the spectral range covered by the sensor becomes smaller.
To illustrate this, in this application note we compare the spectra of a neon glow lamp recorded with three of our self-built DIY spectrometers. All devices use an entrance slit of 10 µmwidth, two mirrors each with a focal length of 150 mm, but different diffraction gratings.
As expected, the following different spectral resolutions were obtained:
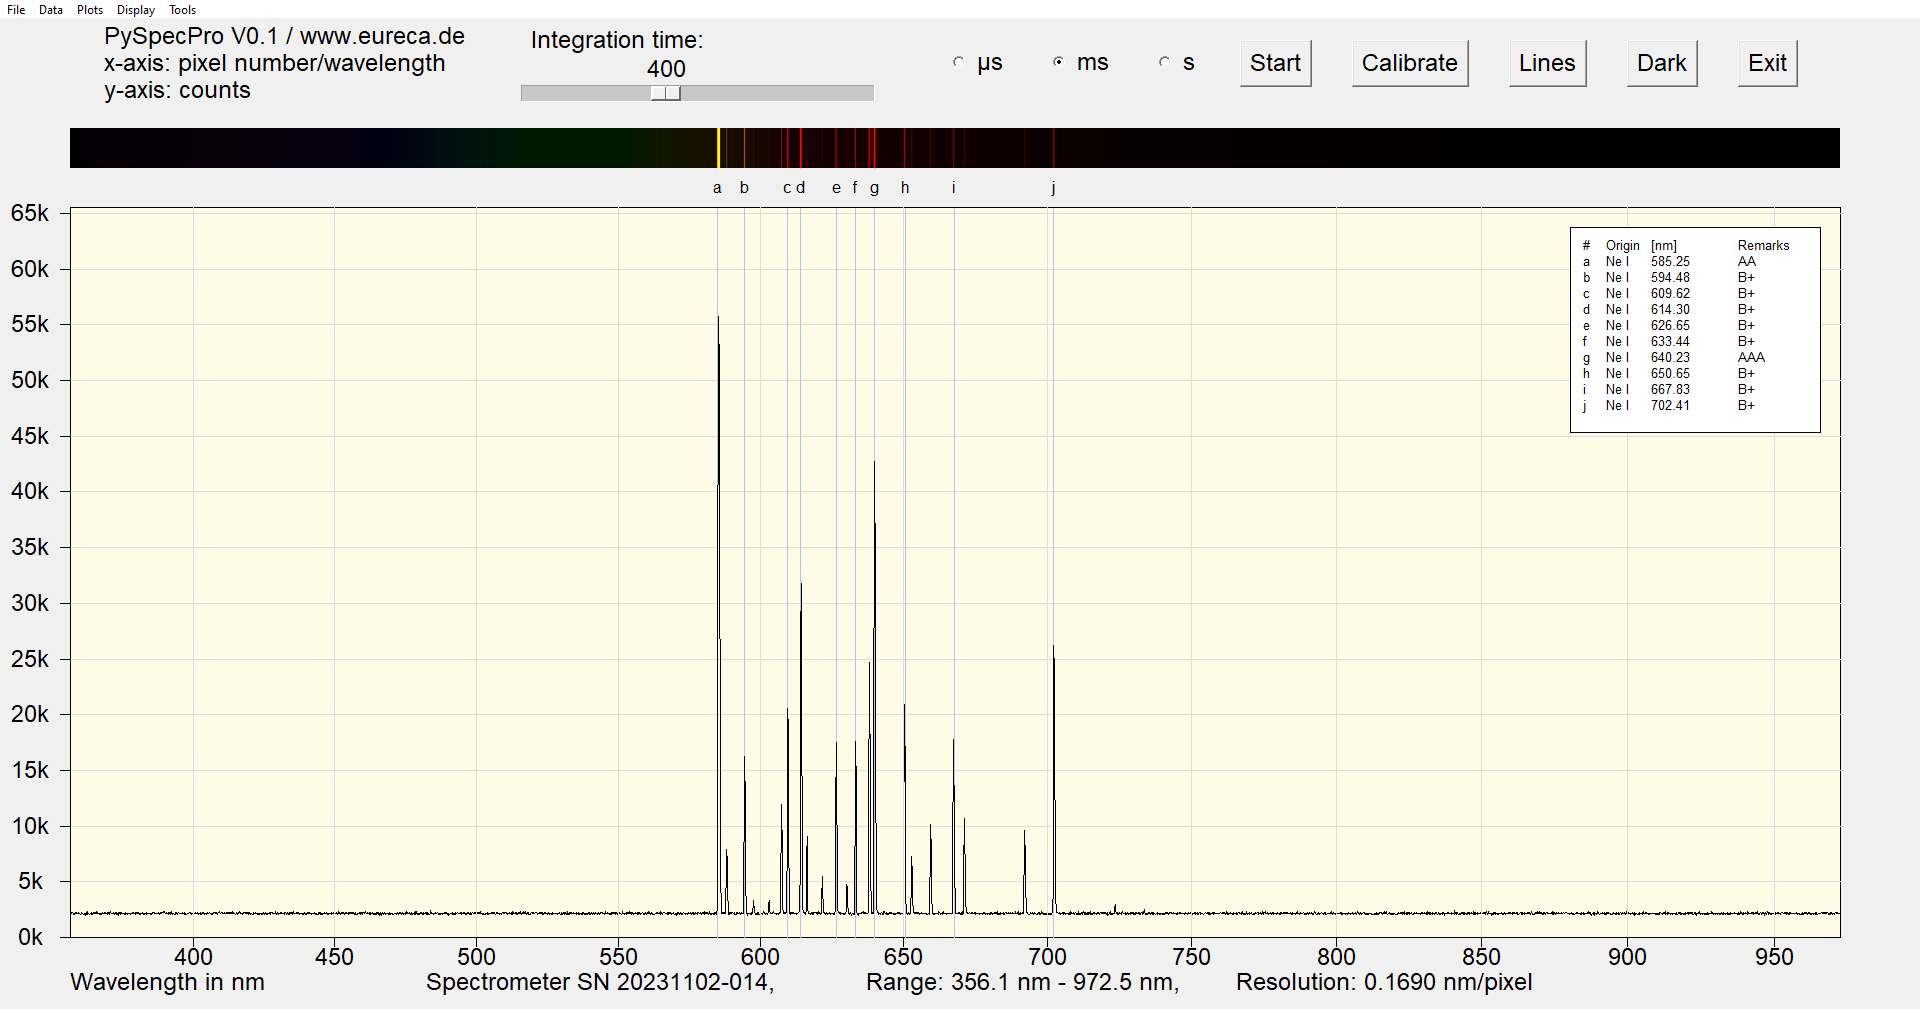
Spectrum of a neon glow lamp, recorded at 300 lp/mm
The spectrometer with the 300 lp/mm grating shows all neon lines in the range between 585 nm and 702 nm in a relatively small part of the sensor. Here, the focus was on the lines in the center of the sensor and, due to the small distance to the center of the sensor, all peaks in the spectrum appear similarly sharp.
Spectrometers with such a relatively small number of lines per millimeter are therefore well suited if you need an overview of a larger spectral range. In our case, the spectral range covered is over 600 nm and is therefore even larger than the spectral sensitivity range of the sensor used.
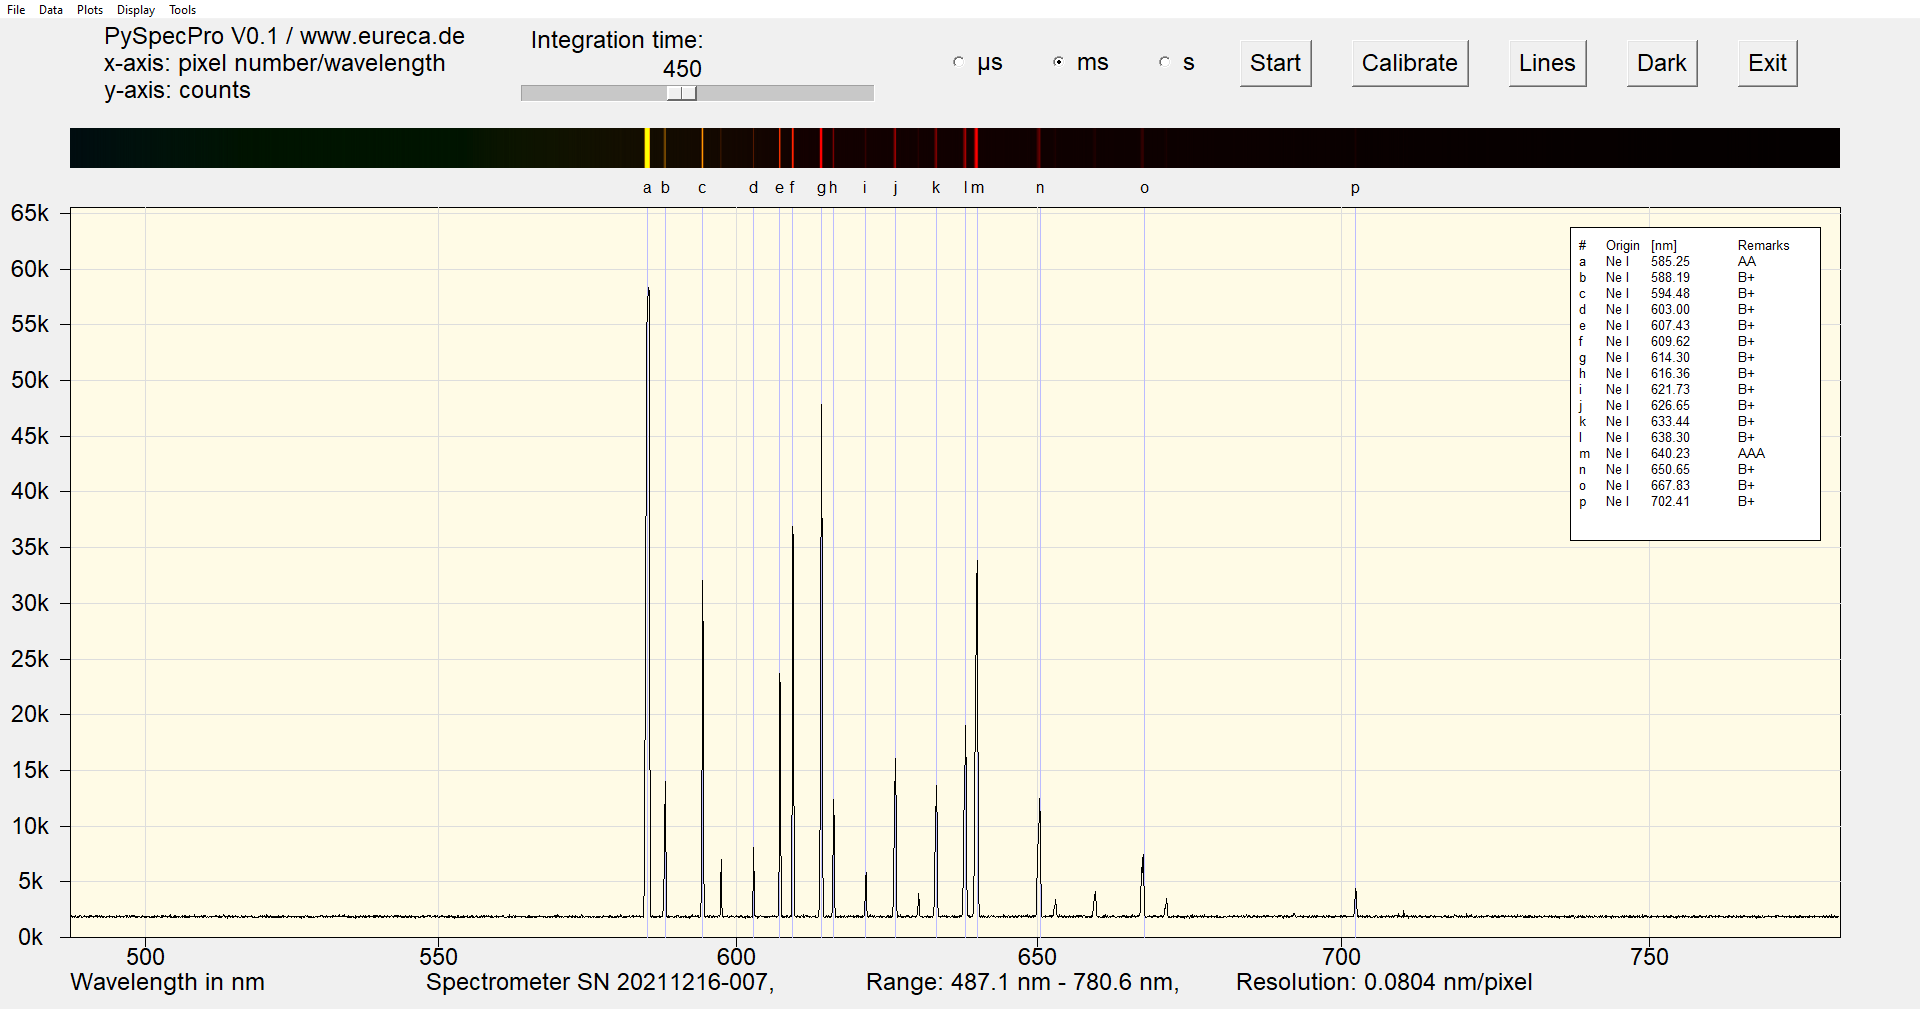
Spectrum of a neon glow lamp, recorded at 600 lp/mm
When using a grating with 600 lp/mm, the peaks of the neon spectrum are recorded over a larger area of the sensor. The spectral range covered is now only approx. 290 nm.
Here, too, the focus was again on the peaks in the center of the sensor. For peaks further away from the center of the sensor, however, there is already a significant increase in the half-width, as these peaks can no longer be imaged sharply on the sensor. This is a known limitation when using a linear sensor to detect signals that lie on a circle of sharpness. We will explain this in more detail in a separate application description.
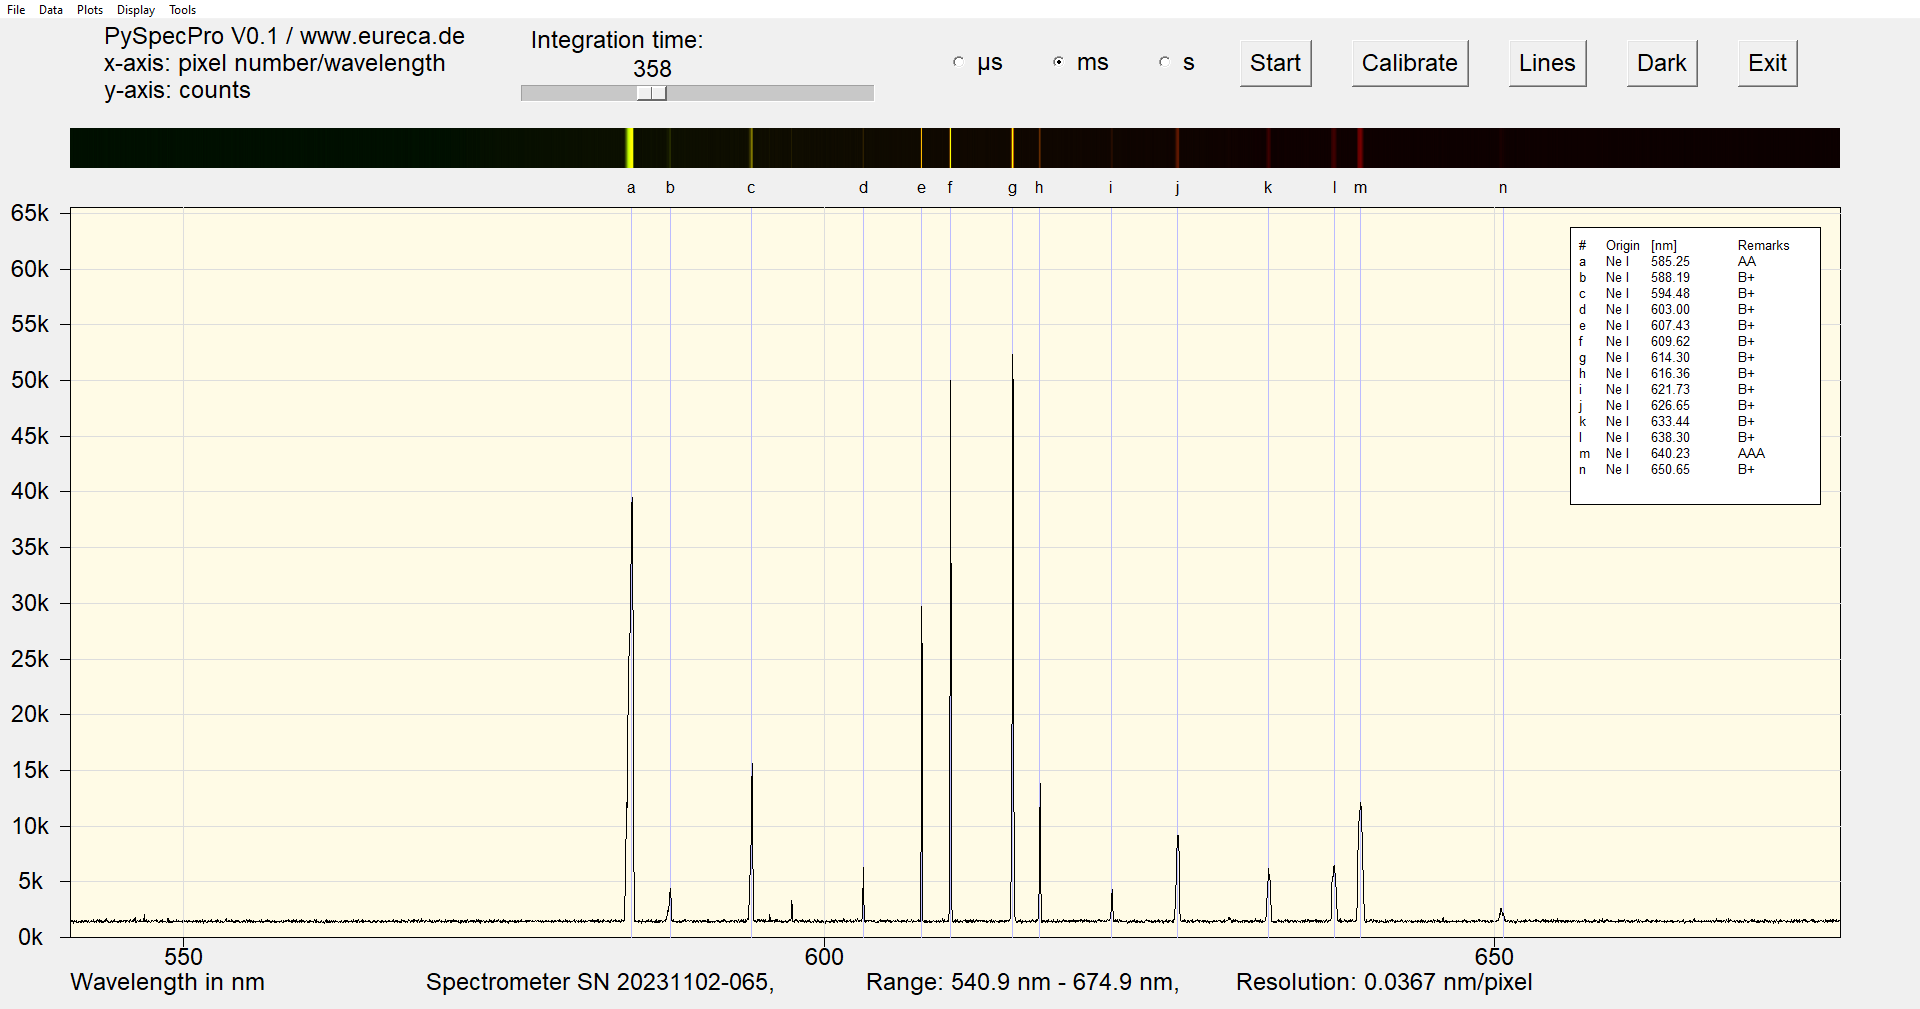
Spectrum of a neon glow lamp, recorded at 1200 lp/mm
The spectrometer with a grating of 1200 lp/mm clearly separates the neon lines from each other once again. With a covered spectral range of approx. 135 nm, this spectrometer is ideal for clearly separating closely spaced peaks.
Here you can easily ask a question or inquiry about our products:
Last update: 2025-02-25

EURECA Messtechnik GmbH
Deutz-Kalker Straße 35, D-50679 Köln
![]()
![]() Phone: +49 (0)221 952629-0
Phone: +49 (0)221 952629-0
Fax: +49 (0)221 952629-9
info(at)eureca.de
www.eureca.de


